In this series: Massachusetts Chronic Absenteeism.
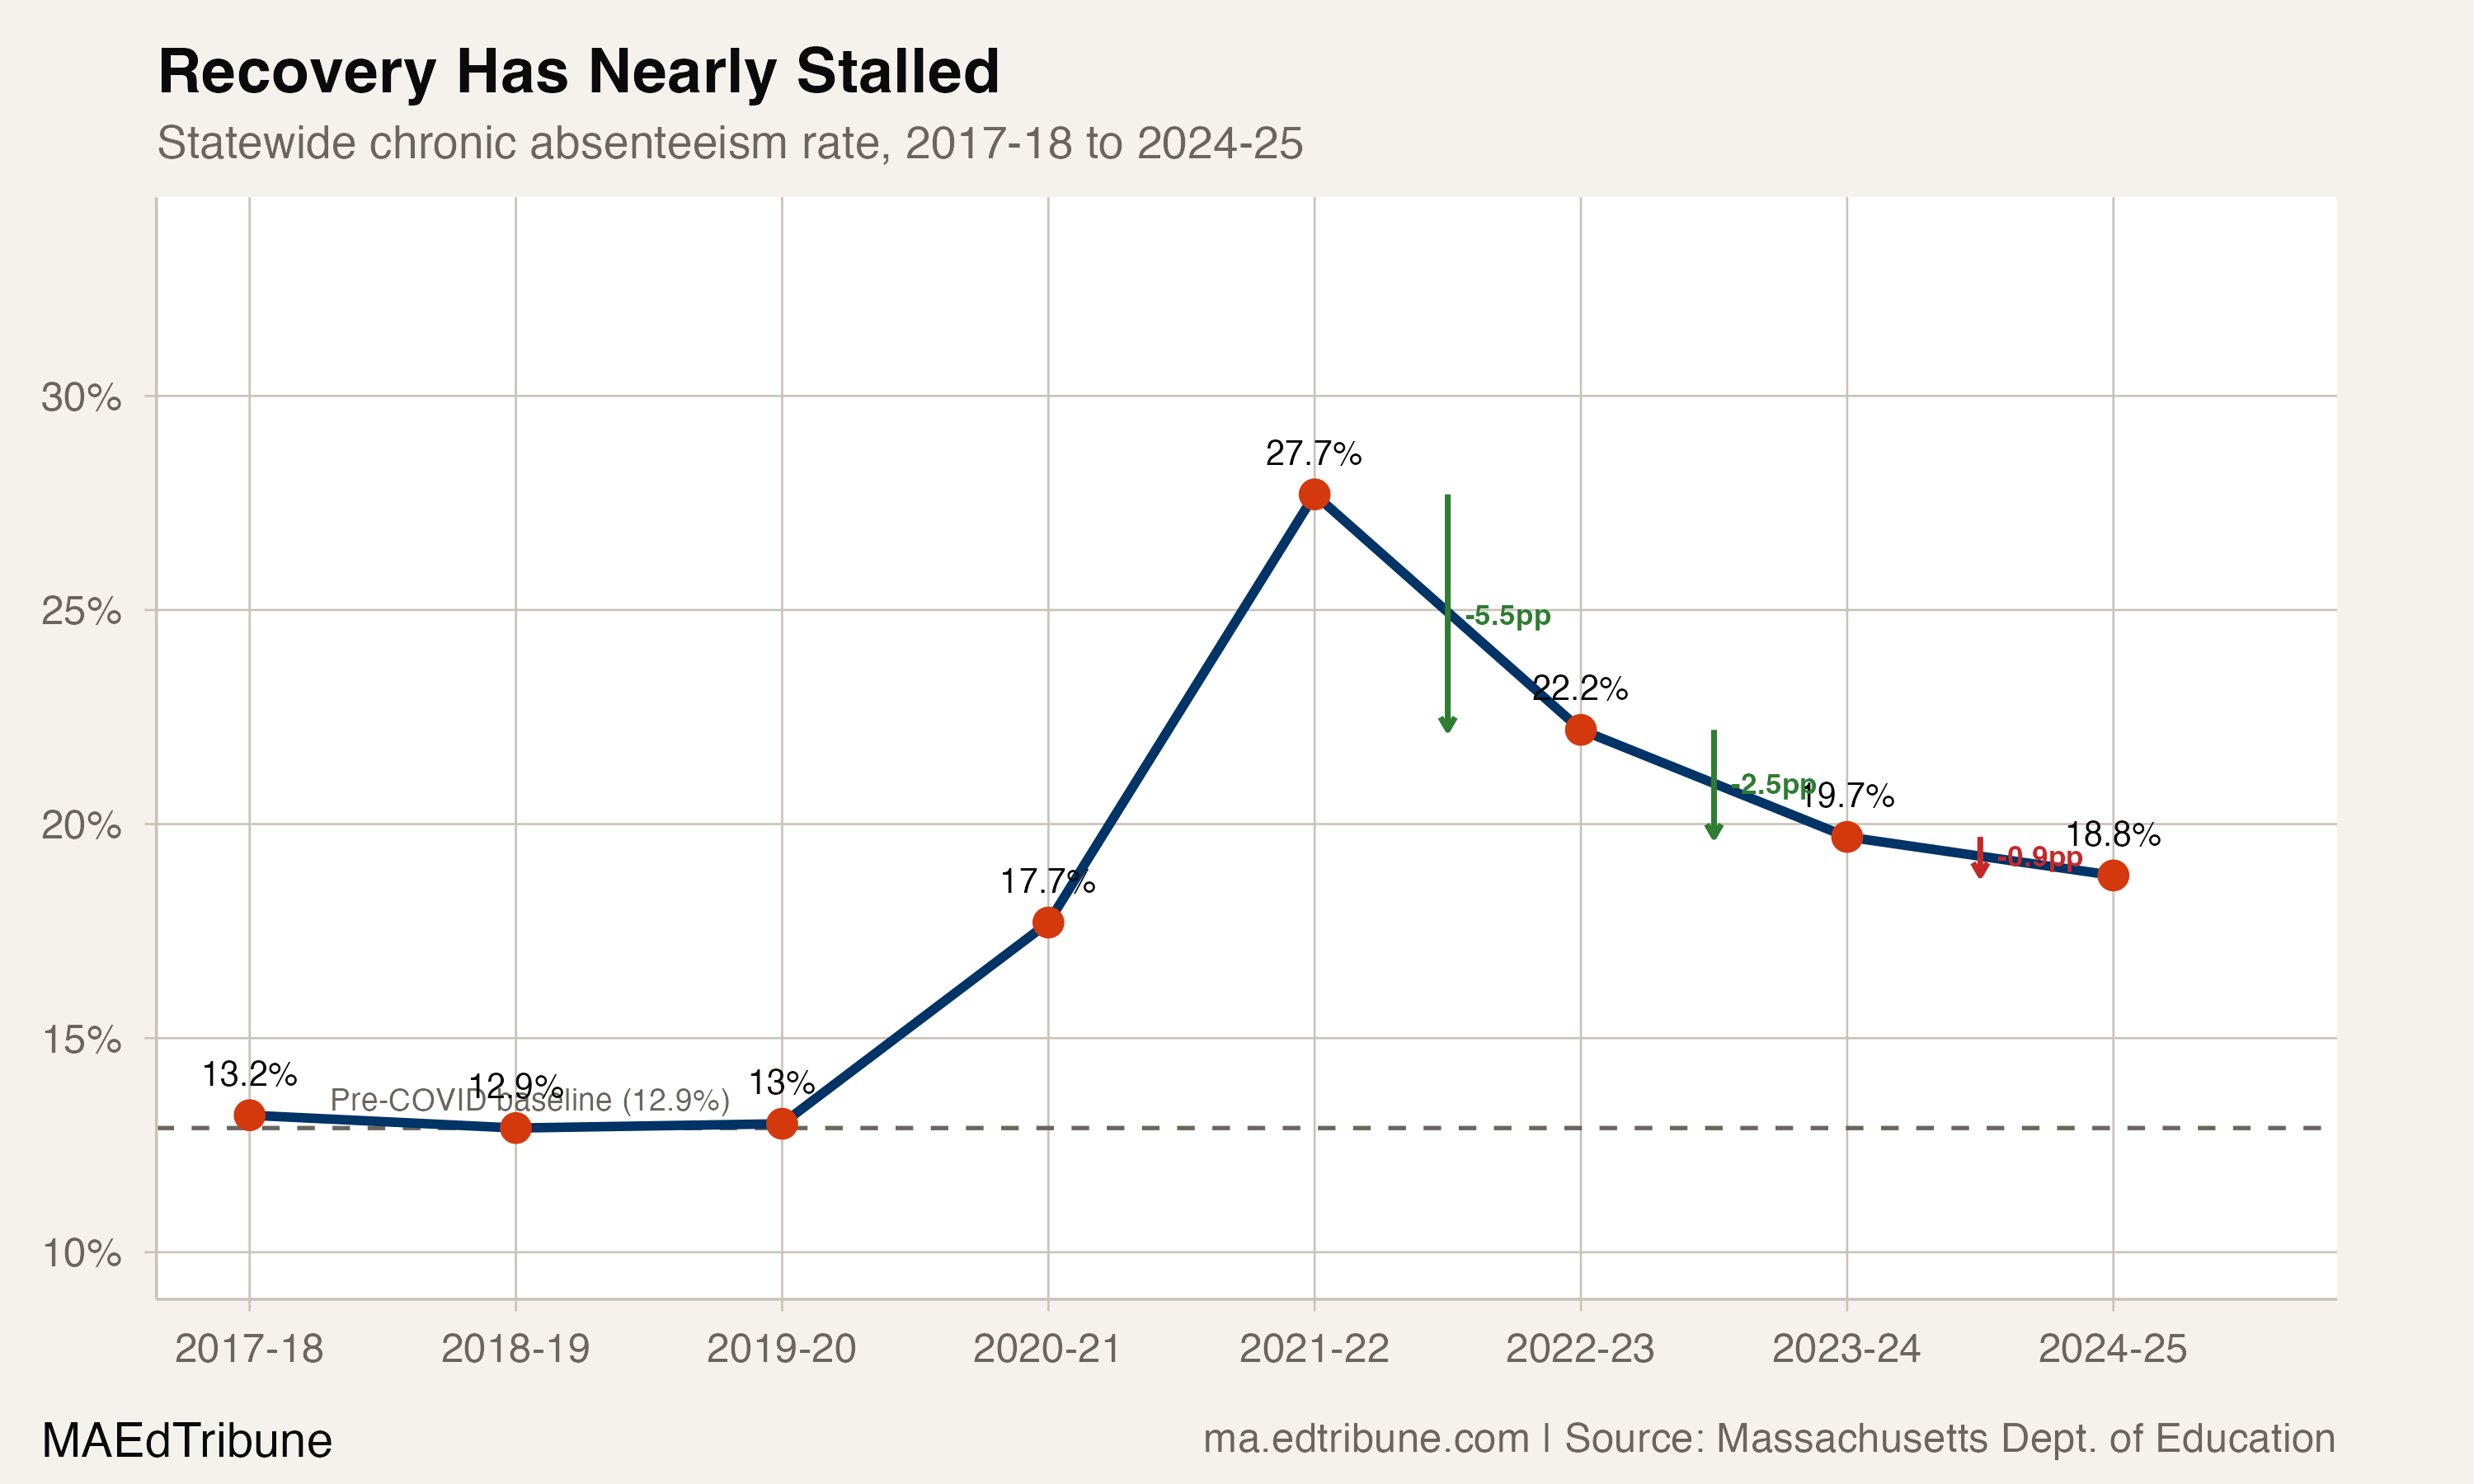
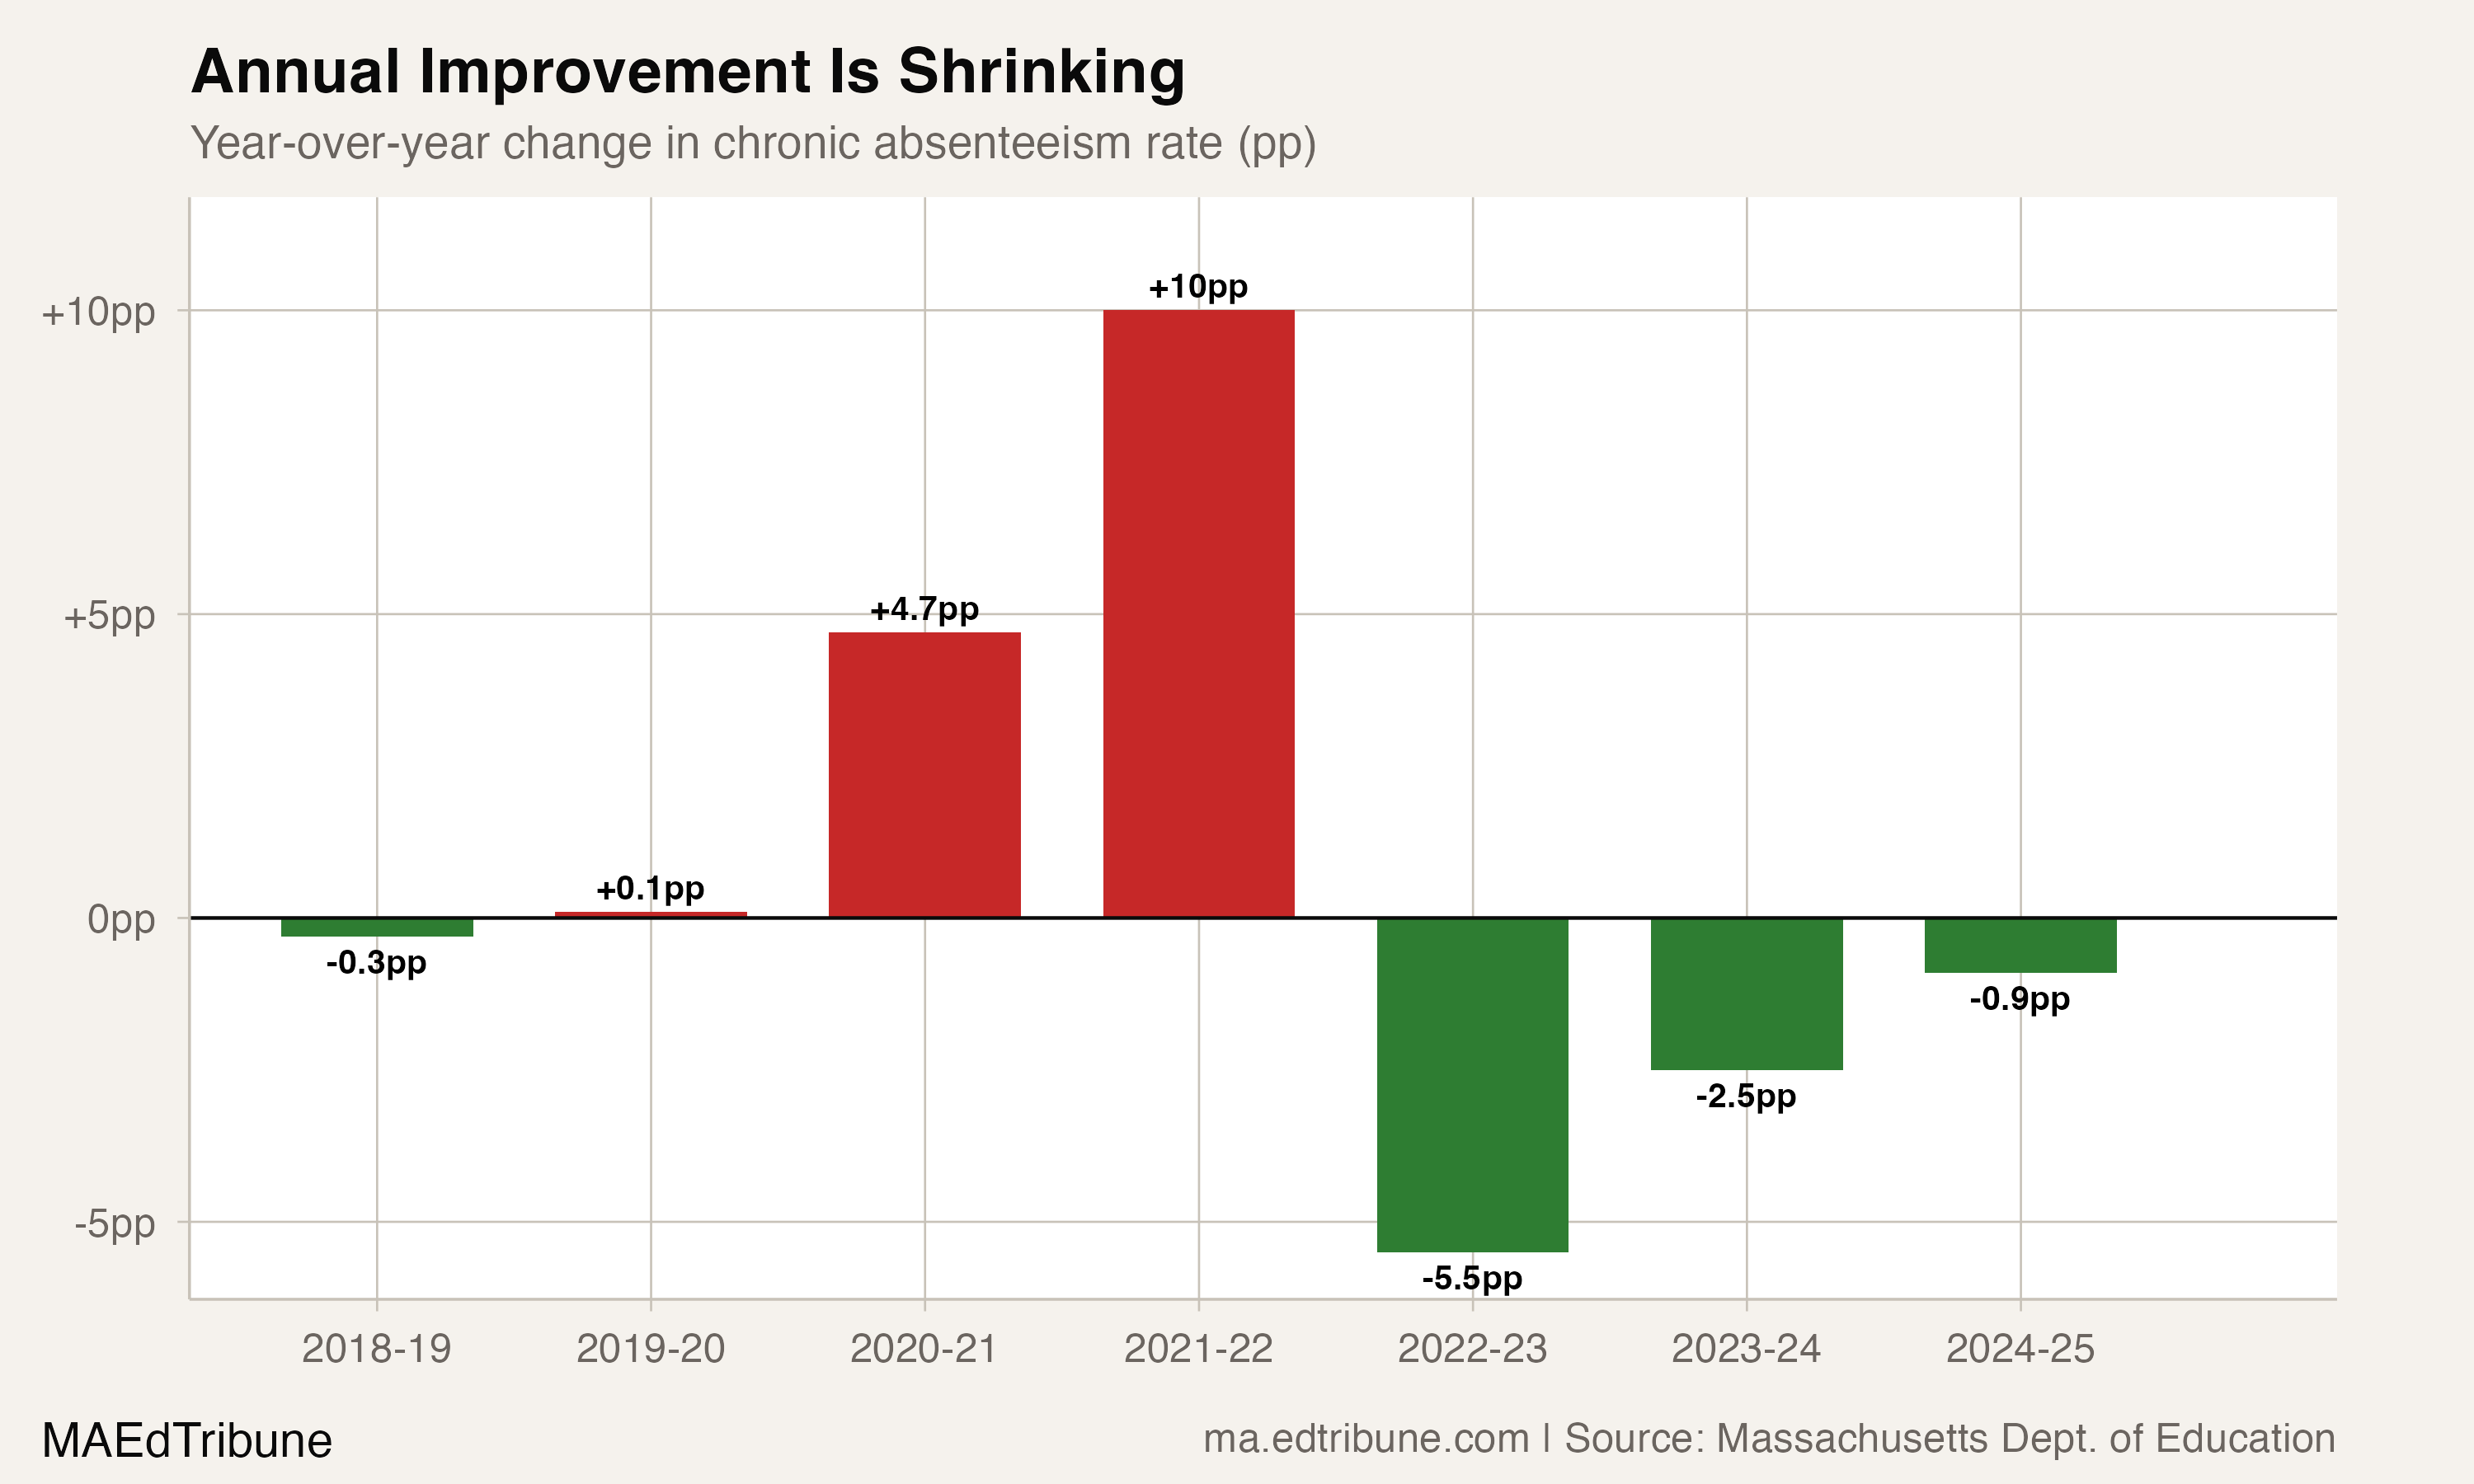
Three years ago, Massachusetts was making real progress on chronic absenteeism. The state cut 5.5 percentage points in a single year, the kind of improvement that made recovery feel inevitable. The next year brought 2.5 points. Last year: 0.9.
The math is simple and discouraging. Massachusetts cut its chronic absenteeism rate from 27.7% in 2021-22 to 18.8% in 2024-25, recovering 60.1% of the ground lost during the pandemic. But the pace of that recovery is collapsing. At 0.9 points per year, the state would need seven more years to reach its pre-COVID baseline of 12.9%.
Seven years assumes the current pace holds. The deceleration curve suggests it will not. Each year's improvement has been roughly a third of the prior year's. If that pattern continues, the rate will plateau somewhere between 17% and 18%, permanently elevated by 4 to 5 percentage points above where it was before the pandemic.
The easy gains are gone
The early years of recovery had a structural tailwind: students who had been completely disengaged during remote learning simply returned to buildings. That drove the 5.5-point drop in 2022-23. The 2.5-point improvement the following year captured the next layer: students whose families had drifted into irregular attendance patterns but were reachable through outreach and engagement campaigns.
The students who remain chronically absent in 2024-25 are harder to reach. Nat Malkus of the American Enterprise Institute has argued that the national stall reflects "across-the-board shifts in attitudes" about daily attendance rather than specific barriers. He points to kindergartners and first-graders, children who were never in school during lockdowns, showing elevated absence rates as evidence that something more fundamental than pandemic disruption is at work.
In Massachusetts, the average student missed 11.9 days in 2024-25, down from 14.8 at the peak but still 2.3 days above the pre-COVID average of 9.6. Those 2.3 extra days per student, spread across more than 915,000 public school students, represent millions of lost instructional hours each year.
39% of districts went backward
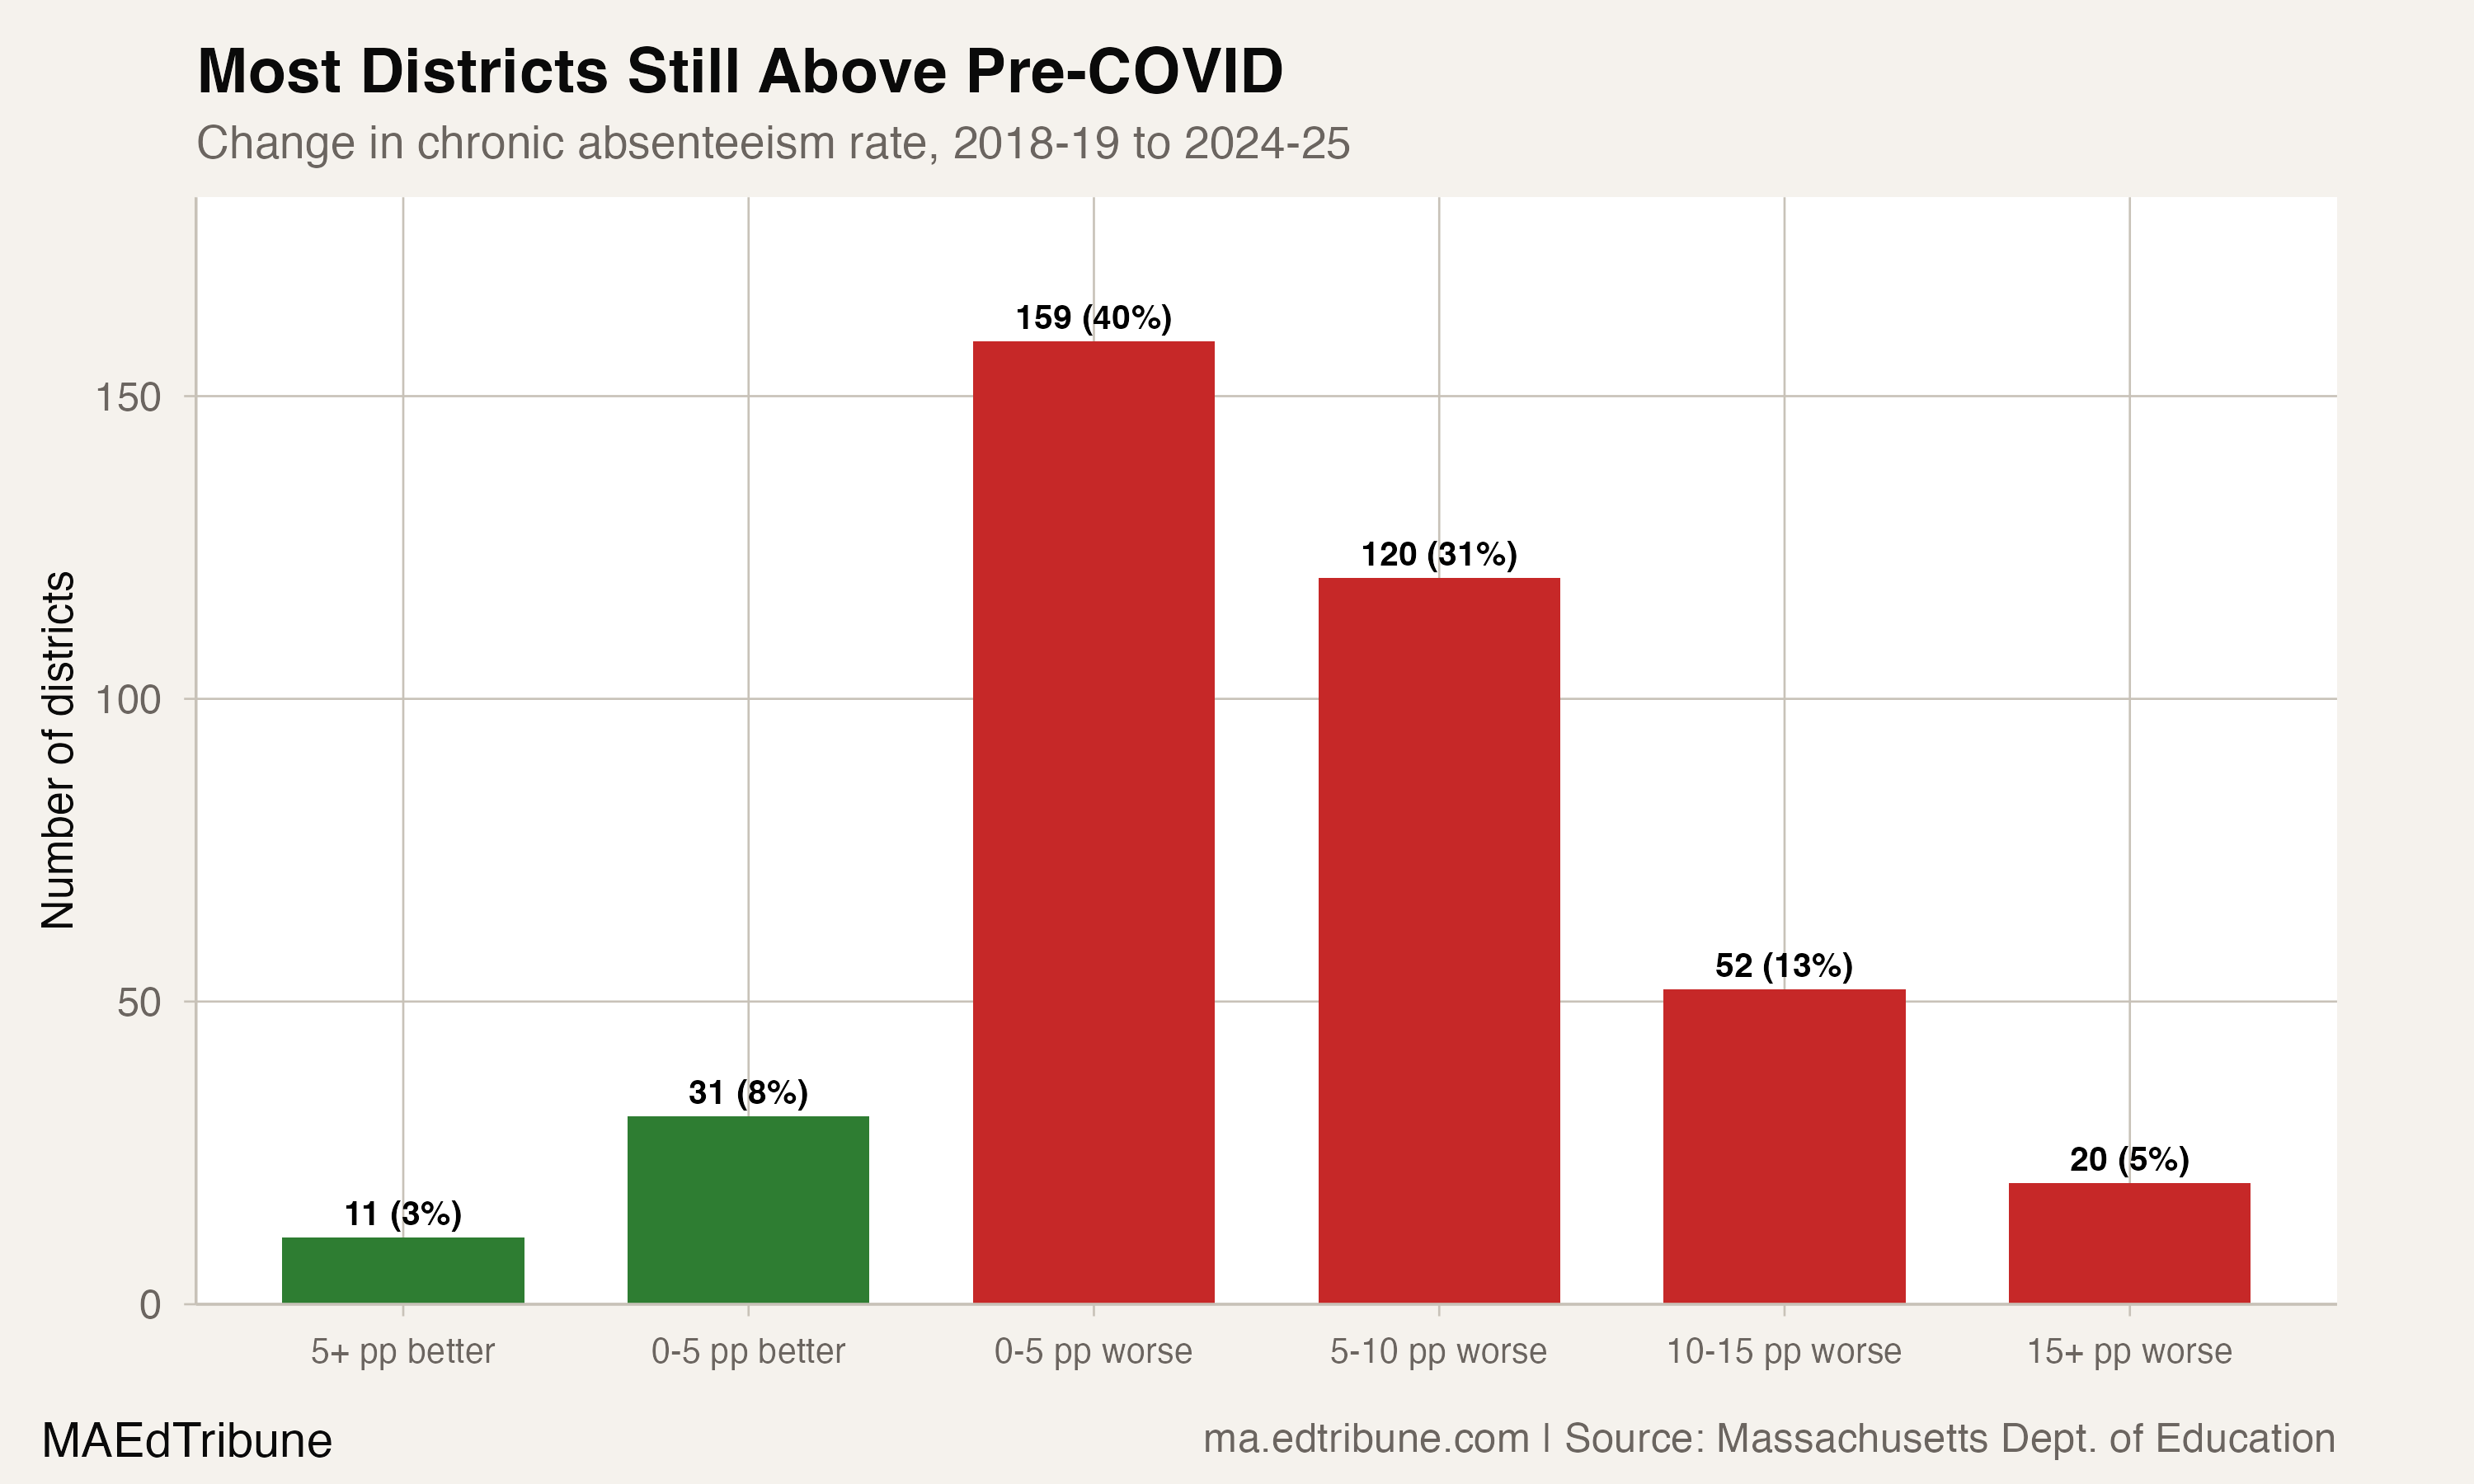
The statewide 0.9-point improvement masks a more fractured reality at the district level. Of 393 districts with data for both years, 154 saw their chronic absenteeism rate increase in 2024-25. Another 8 were flat. Only 231 improved, and the median improvement was just half a percentage point.
The broader picture is starker: 351 of 393 districts, 89.3%, remain above their pre-COVID chronic absenteeism rates. Only 42 have returned to or fallen below their 2018-19 baseline. Among the 34 districts where more than 30% of students are chronically absent, Holyoke↗ET stands at 42.4%, Pittsfield↗ET at 38.6%, and Boston↗ET at 33.0%.
The burden is not equally shared
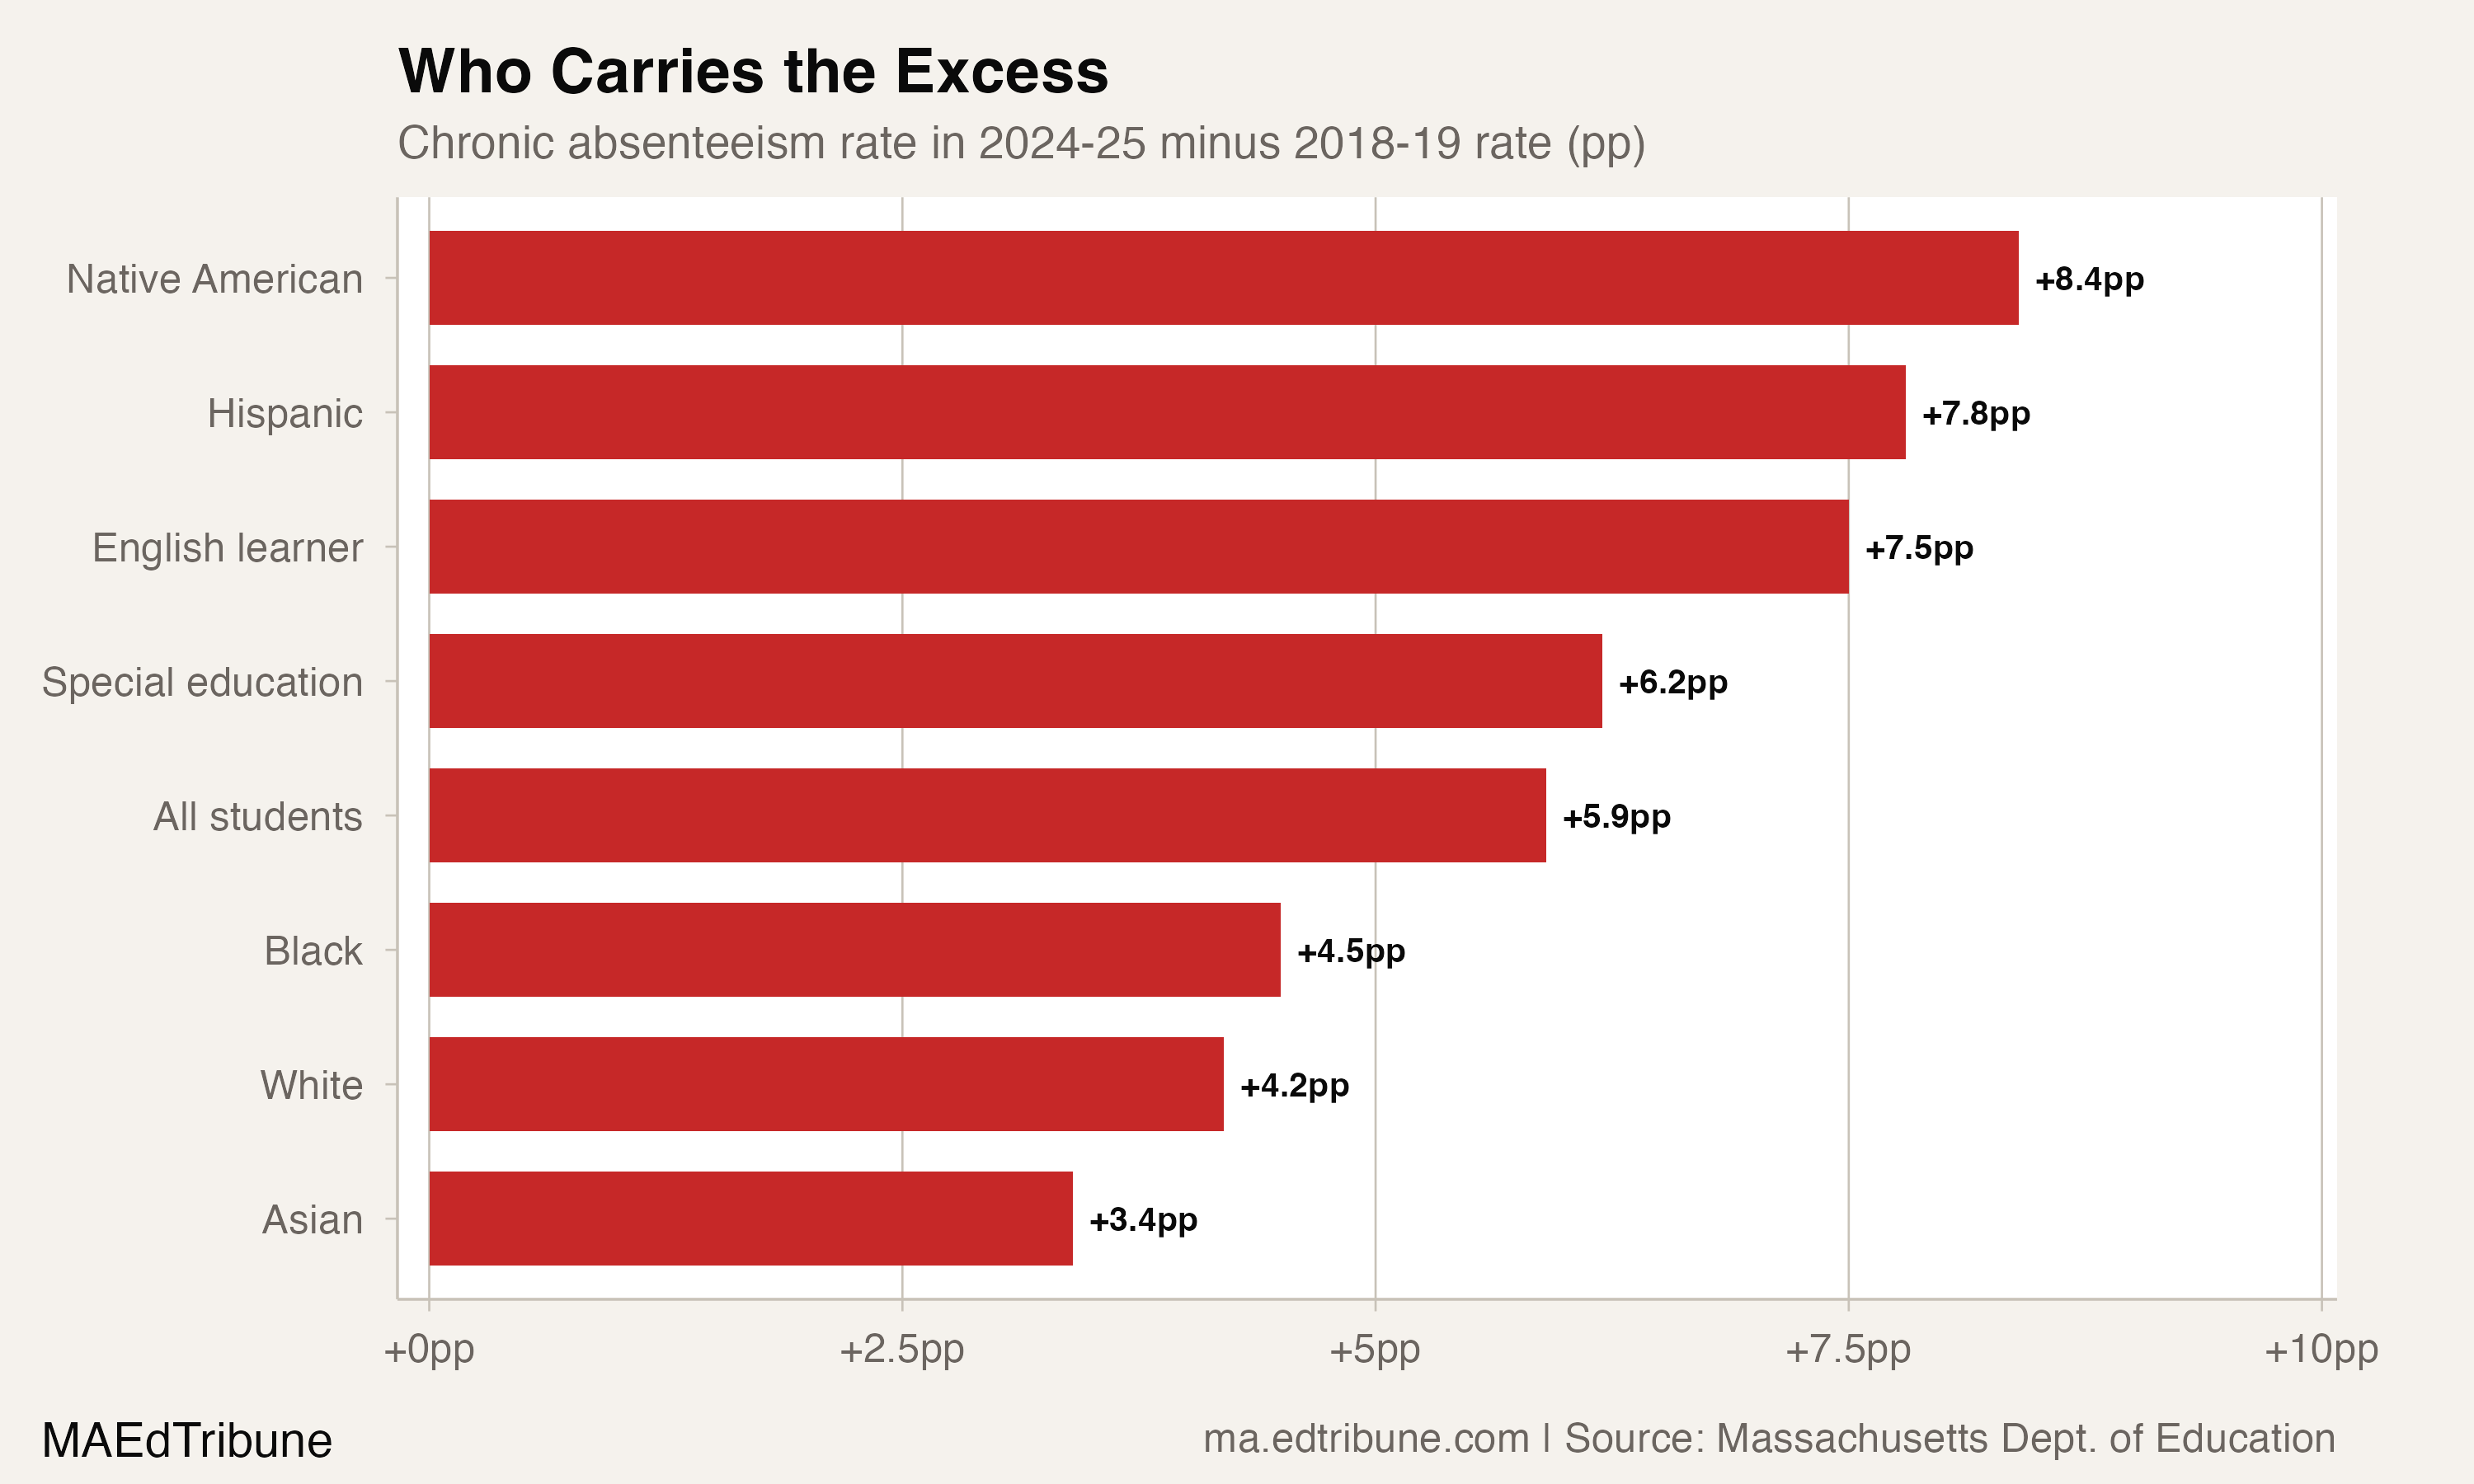
Native American students carry the largest excess above their pre-COVID rate: 8.4 percentage points, with chronic absenteeism at 27.3% in 2024-25 compared to 18.9% before the pandemic. Hispanic students follow at 7.8 points of excess (29.5% current vs. 21.7% pre-COVID), and English learners at 7.5 points (27.8% vs. 20.3%). These three groups overlap substantially. Many English learners are Hispanic, and both populations face the compounding barriers of housing instability, transportation access, and family work schedules that make consistent attendance structurally harder.
White students, by contrast, carry 4.2 points of excess, the second-smallest gap behind Asian students at 3.4 points. The Hispanic-white chronic absenteeism gap widened from 12.0 percentage points before the pandemic to 20.2 at the peak. It has narrowed to 15.6 points in 2024-25, but that is still 30% wider than it was in 2018-19. The pandemic did not create this gap. It amplified it, and three years of recovery have not brought it back.
Black students are the one group where recovery has been notably faster, reaching 71.5% of the way back to pre-COVID levels compared to 60.1% statewide. At 20.7%, the Black chronic absenteeism rate remains elevated, but the 4.5 points of remaining excess is the third-smallest among racial groups.
Two Gateway Cities, two trajectories
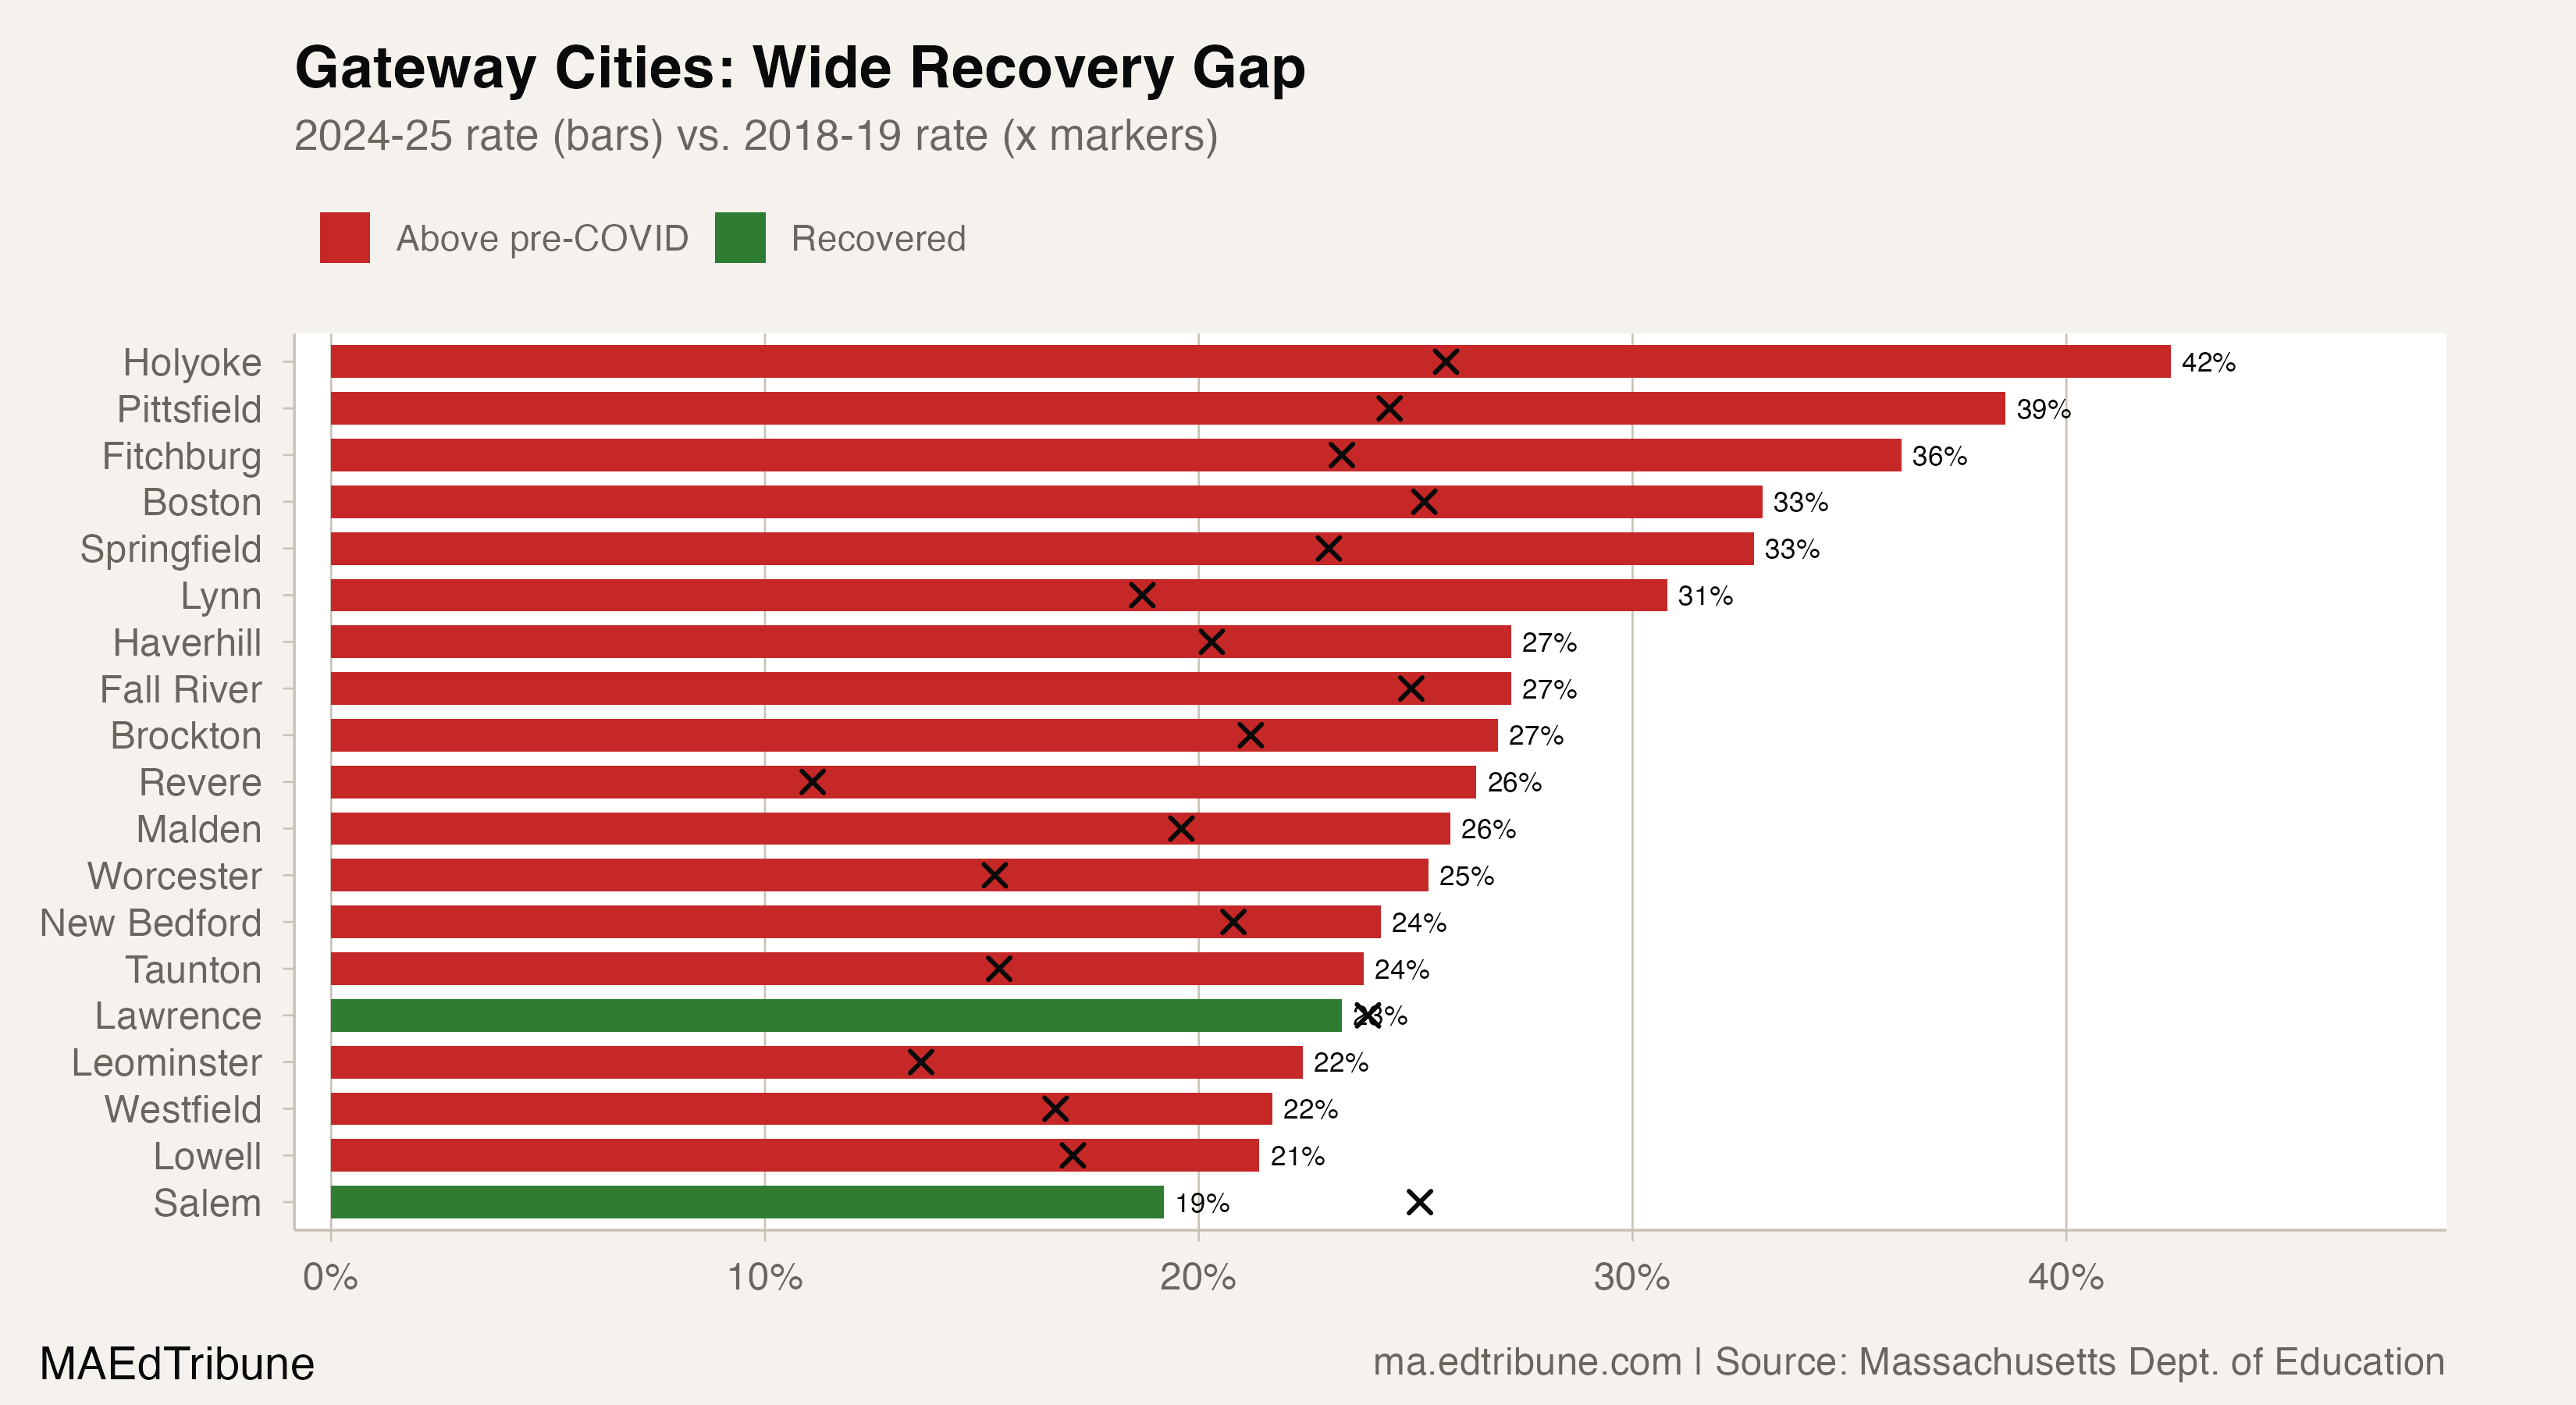
Massachusetts designates 26 former industrial cities as Gateway Cities, communities with below-average incomes and educational attainment that receive additional state resources. The chronic absenteeism data reveals how differently the recovery has played out across these cities.
Lawrence's story is distinctive because the recovery happened in a district under state receivership since 2012, serving a student population that is heavily immigrant and low-income. The district's Homeless/Newcomer Coalition, described in the Boston Globe, individually tracks every homeless and newly arrived student and coordinates wraparound services across agencies. The result: a 20.2-point drop from peak, returning to 23.3%, marginally below the pre-COVID rate of 23.9%.
New Bedford↗ET made the largest single-year improvement of any Gateway City in 2024-25, dropping 7.9 points to 24.2%, reaching 87.5% recovery. Fall River↗ET followed a similar arc, improving 3.2 points to 27.2% and recovering 90.2% of its COVID spike.
At the other extreme, Pittsfield is worse than its pandemic peak: 38.6% in 2024-25, up from 38.2% in 2021-22 and 24.4% before the pandemic. Its recovery rate is negative 2.9%. Holyoke, despite exiting state receivership in July 2025, remains at 42.4%, 16.7 points above its pre-COVID rate and only 41.2% recovered. Springfield↗ET, the state's fourth-largest district, sits at 32.8% with chronic absenteeism ticking up 0.4 points in the most recent year after two years of improvement.
Boston, the state's largest district, has one in three students chronically absent. Its rate of 33.0% represents 54.1% recovery, but the remaining 7.8 points of excess are concentrated among Hispanic students, whose chronic absenteeism rate of 40.7% is 10.2 points above pre-COVID.
"We know that a lot of students have been absent because of continued worries about illness, mental health issues and then just a change in habits." — Russell Johnston, acting Commissioner of Education, NEPM, May 2024
What Lawrence teaches, and what it does not
The Lawrence model, individual case management through a cross-agency coalition, is resource-intensive. It works in a district of roughly 13,300 students where the specific barriers (housing, immigration status, language) are identifiable and addressable through coordinated social services. Whether that model scales to Boston's 46,000 students or Springfield's 23,700, each with a broader mix of attendance barriers, is an open question.
Research from the National Low Income Housing Coalition identifies housing instability as the single strongest predictor of chronic absenteeism, stronger than poverty alone. Massachusetts schools filed 5,400 Child Requiring Assistance petitions between FY2022 and FY2025, a legal tool for truancy, but filing paperwork does not address the housing, transportation, and health barriers that keep students home.
The state's FY25 budget fully funds the Student Opportunity Act, which directs additional dollars to high-need districts, particularly Gateway Cities. Whether those resources translate into the kind of individualized, persistent case management that worked in Lawrence will determine whether the recovery curve bends upward again or flattens into a new, higher baseline.
What comes next
The central question is whether 18% to 19% chronic absenteeism is the new normal for Massachusetts. The national data suggests it might be. Across 39 states, chronic absenteeism remains roughly 50% above pre-pandemic levels, and improvement in 2024-25 slowed to about 1 percentage point nationally, closely mirroring what Massachusetts experienced.
If the state's rate stabilizes near 18%, that means roughly 172,000 students missing 18 or more school days every year, about 54,000 more than before the pandemic. For districts already grappling with enrollment decline and tightening budgets, the fiscal math of addressing chronic absenteeism at scale, the attendance coordinators, the social workers, the transportation subsidies, competes directly with every other spending priority. Pittsfield, where the rate is rising, and Lawrence, where a decade of state receivership built the infrastructure for intensive intervention, illustrate the distance between knowing what works and having the capacity to do it.
Detailed code that reproduces the analysis and figures in this article is available exclusively to EdTribune subscribers.
Discussion
Sign in to join the discussion.
Loading comments...