In this series: Massachusetts Chronic Absenteeism.
Correction (July 21, 2026): The original article called the 27.3% Native American rate more than double the 13.9% white rate; the unrounded ratio is 1.96. It also called the 3.6-point Hispanic-white expansion second largest, but the Pacific Islander-white gap widened by 3.8 points. This version corrects those comparisons, removes unsupported historical, causal, program, agency and seven-year forecast claims, and rebuilds all four charts and the claim ledger from fresh state-package output.
Massachusetts reported a 27.3% chronic-absence rate for Native American students in 2025 and a 13.9% rate for white students. The Native American rate was 1.96 times the white rate, and the gap was 13.4 percentage points.
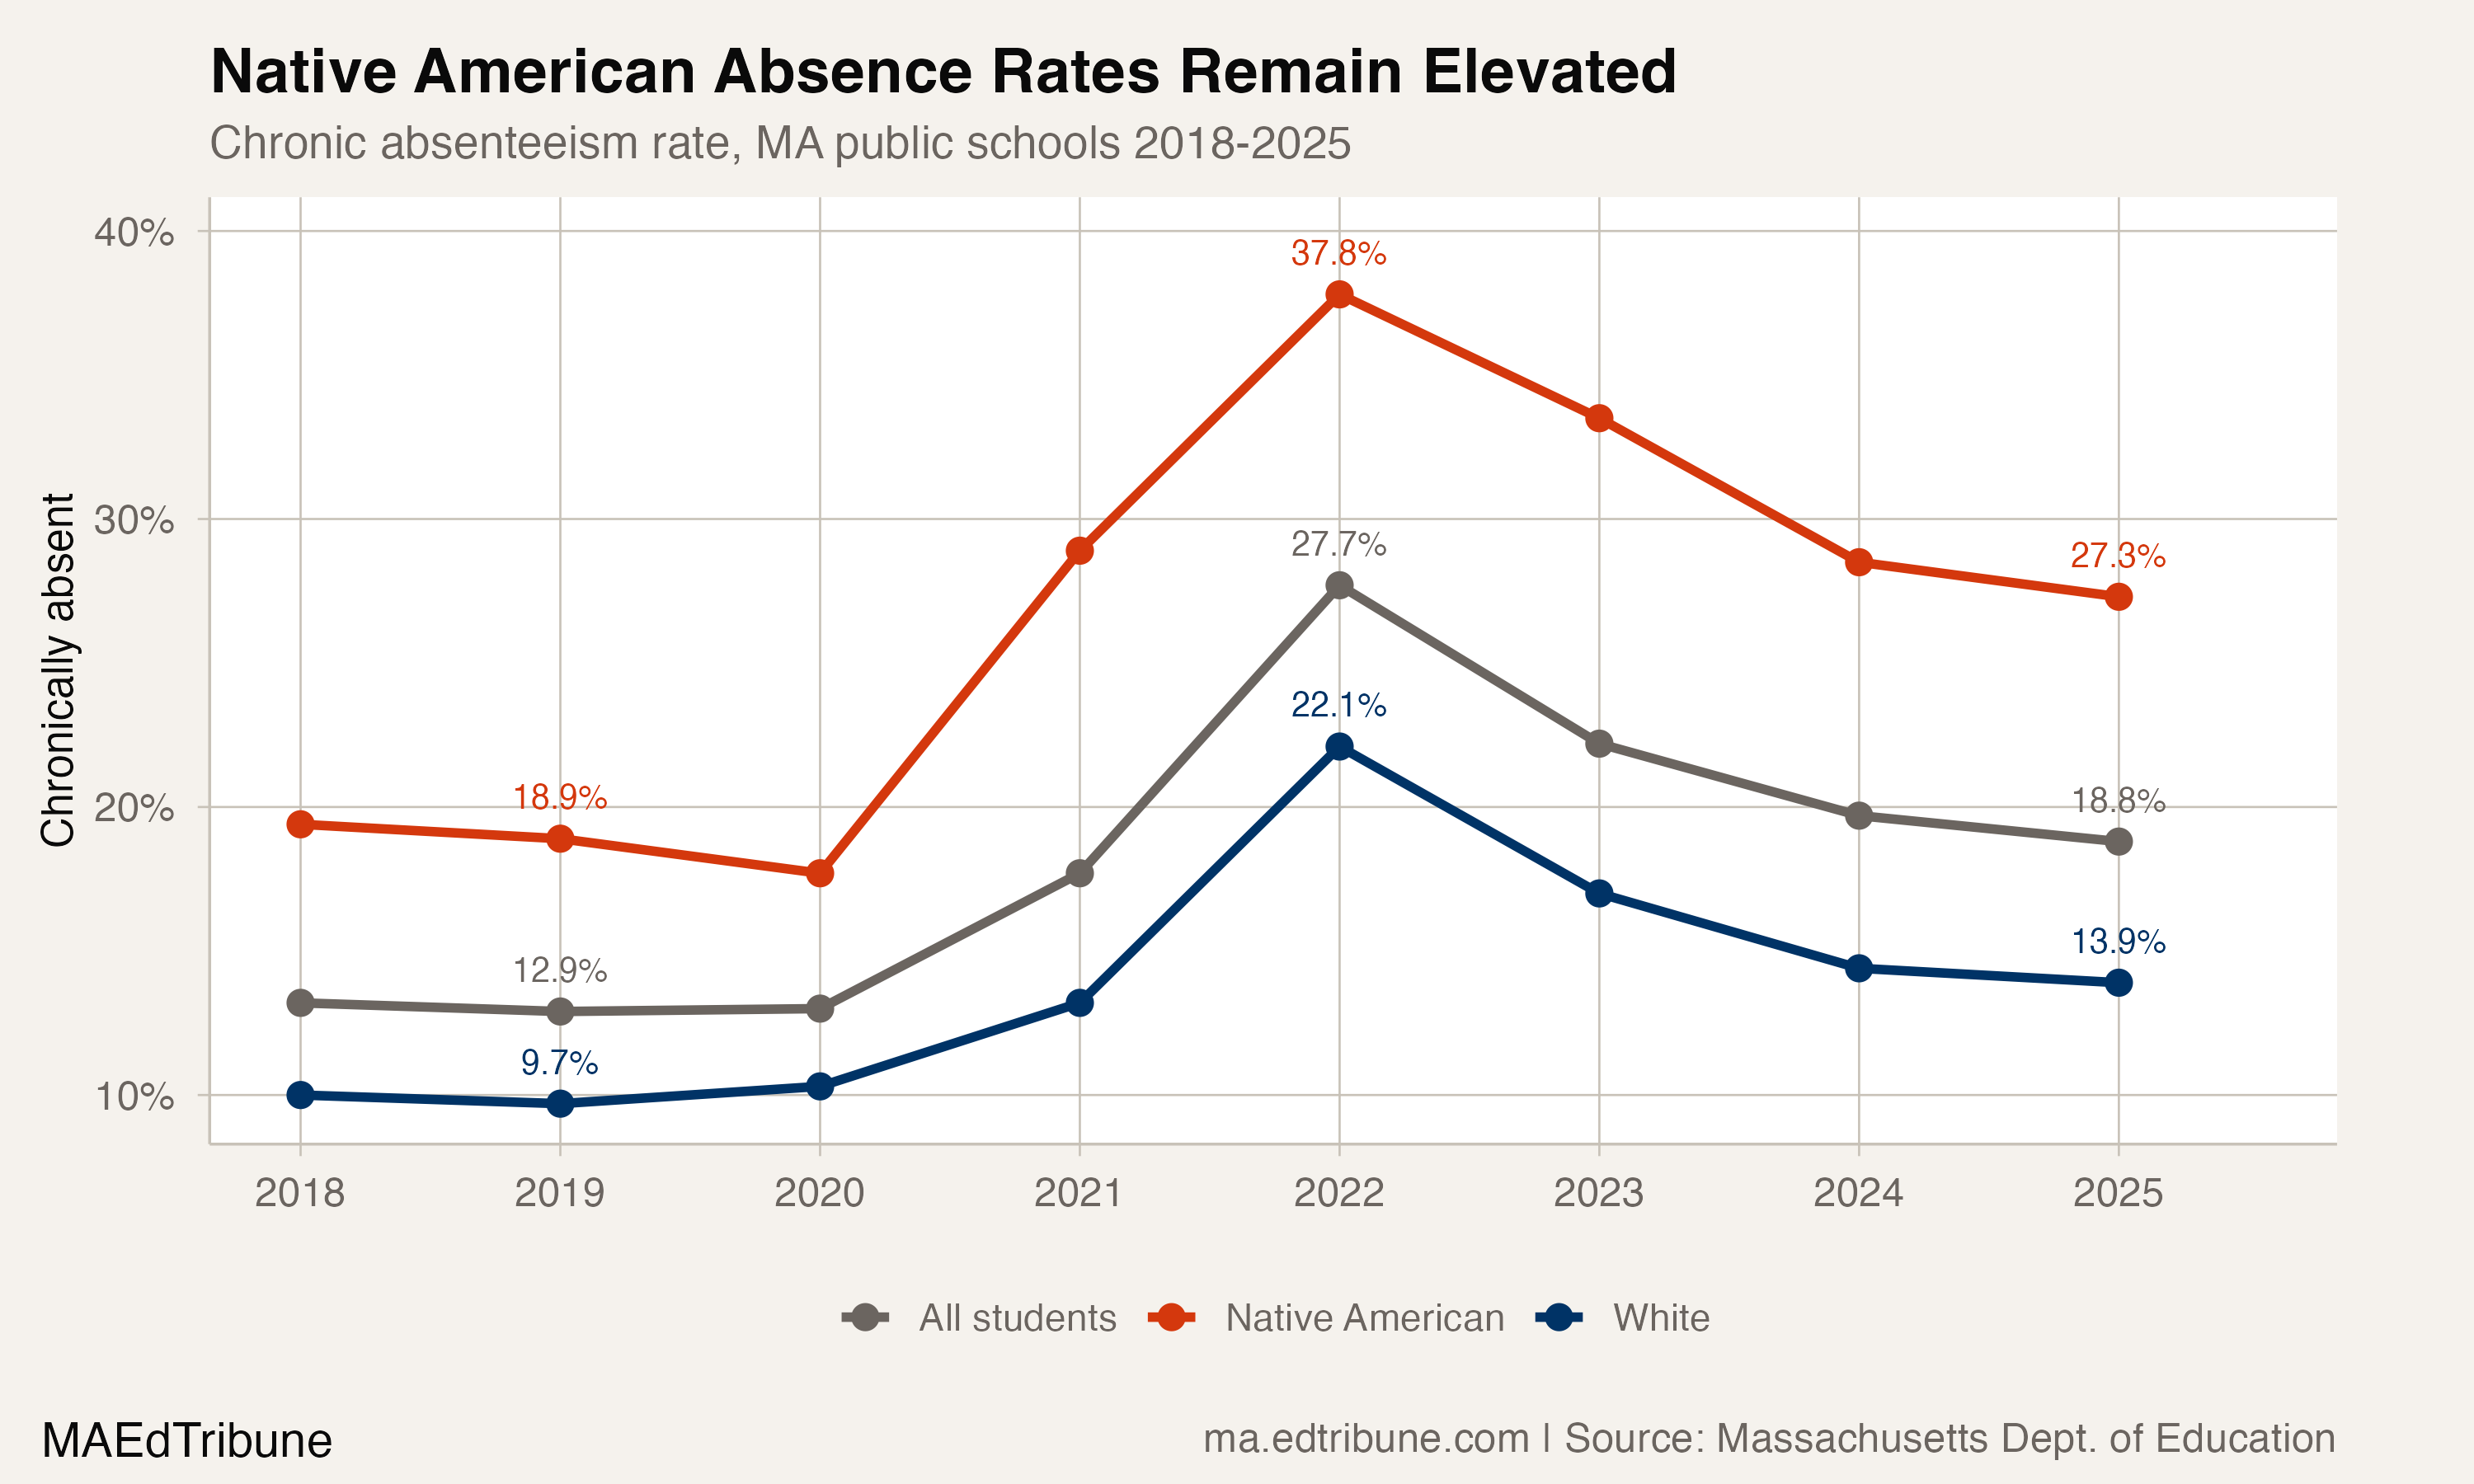
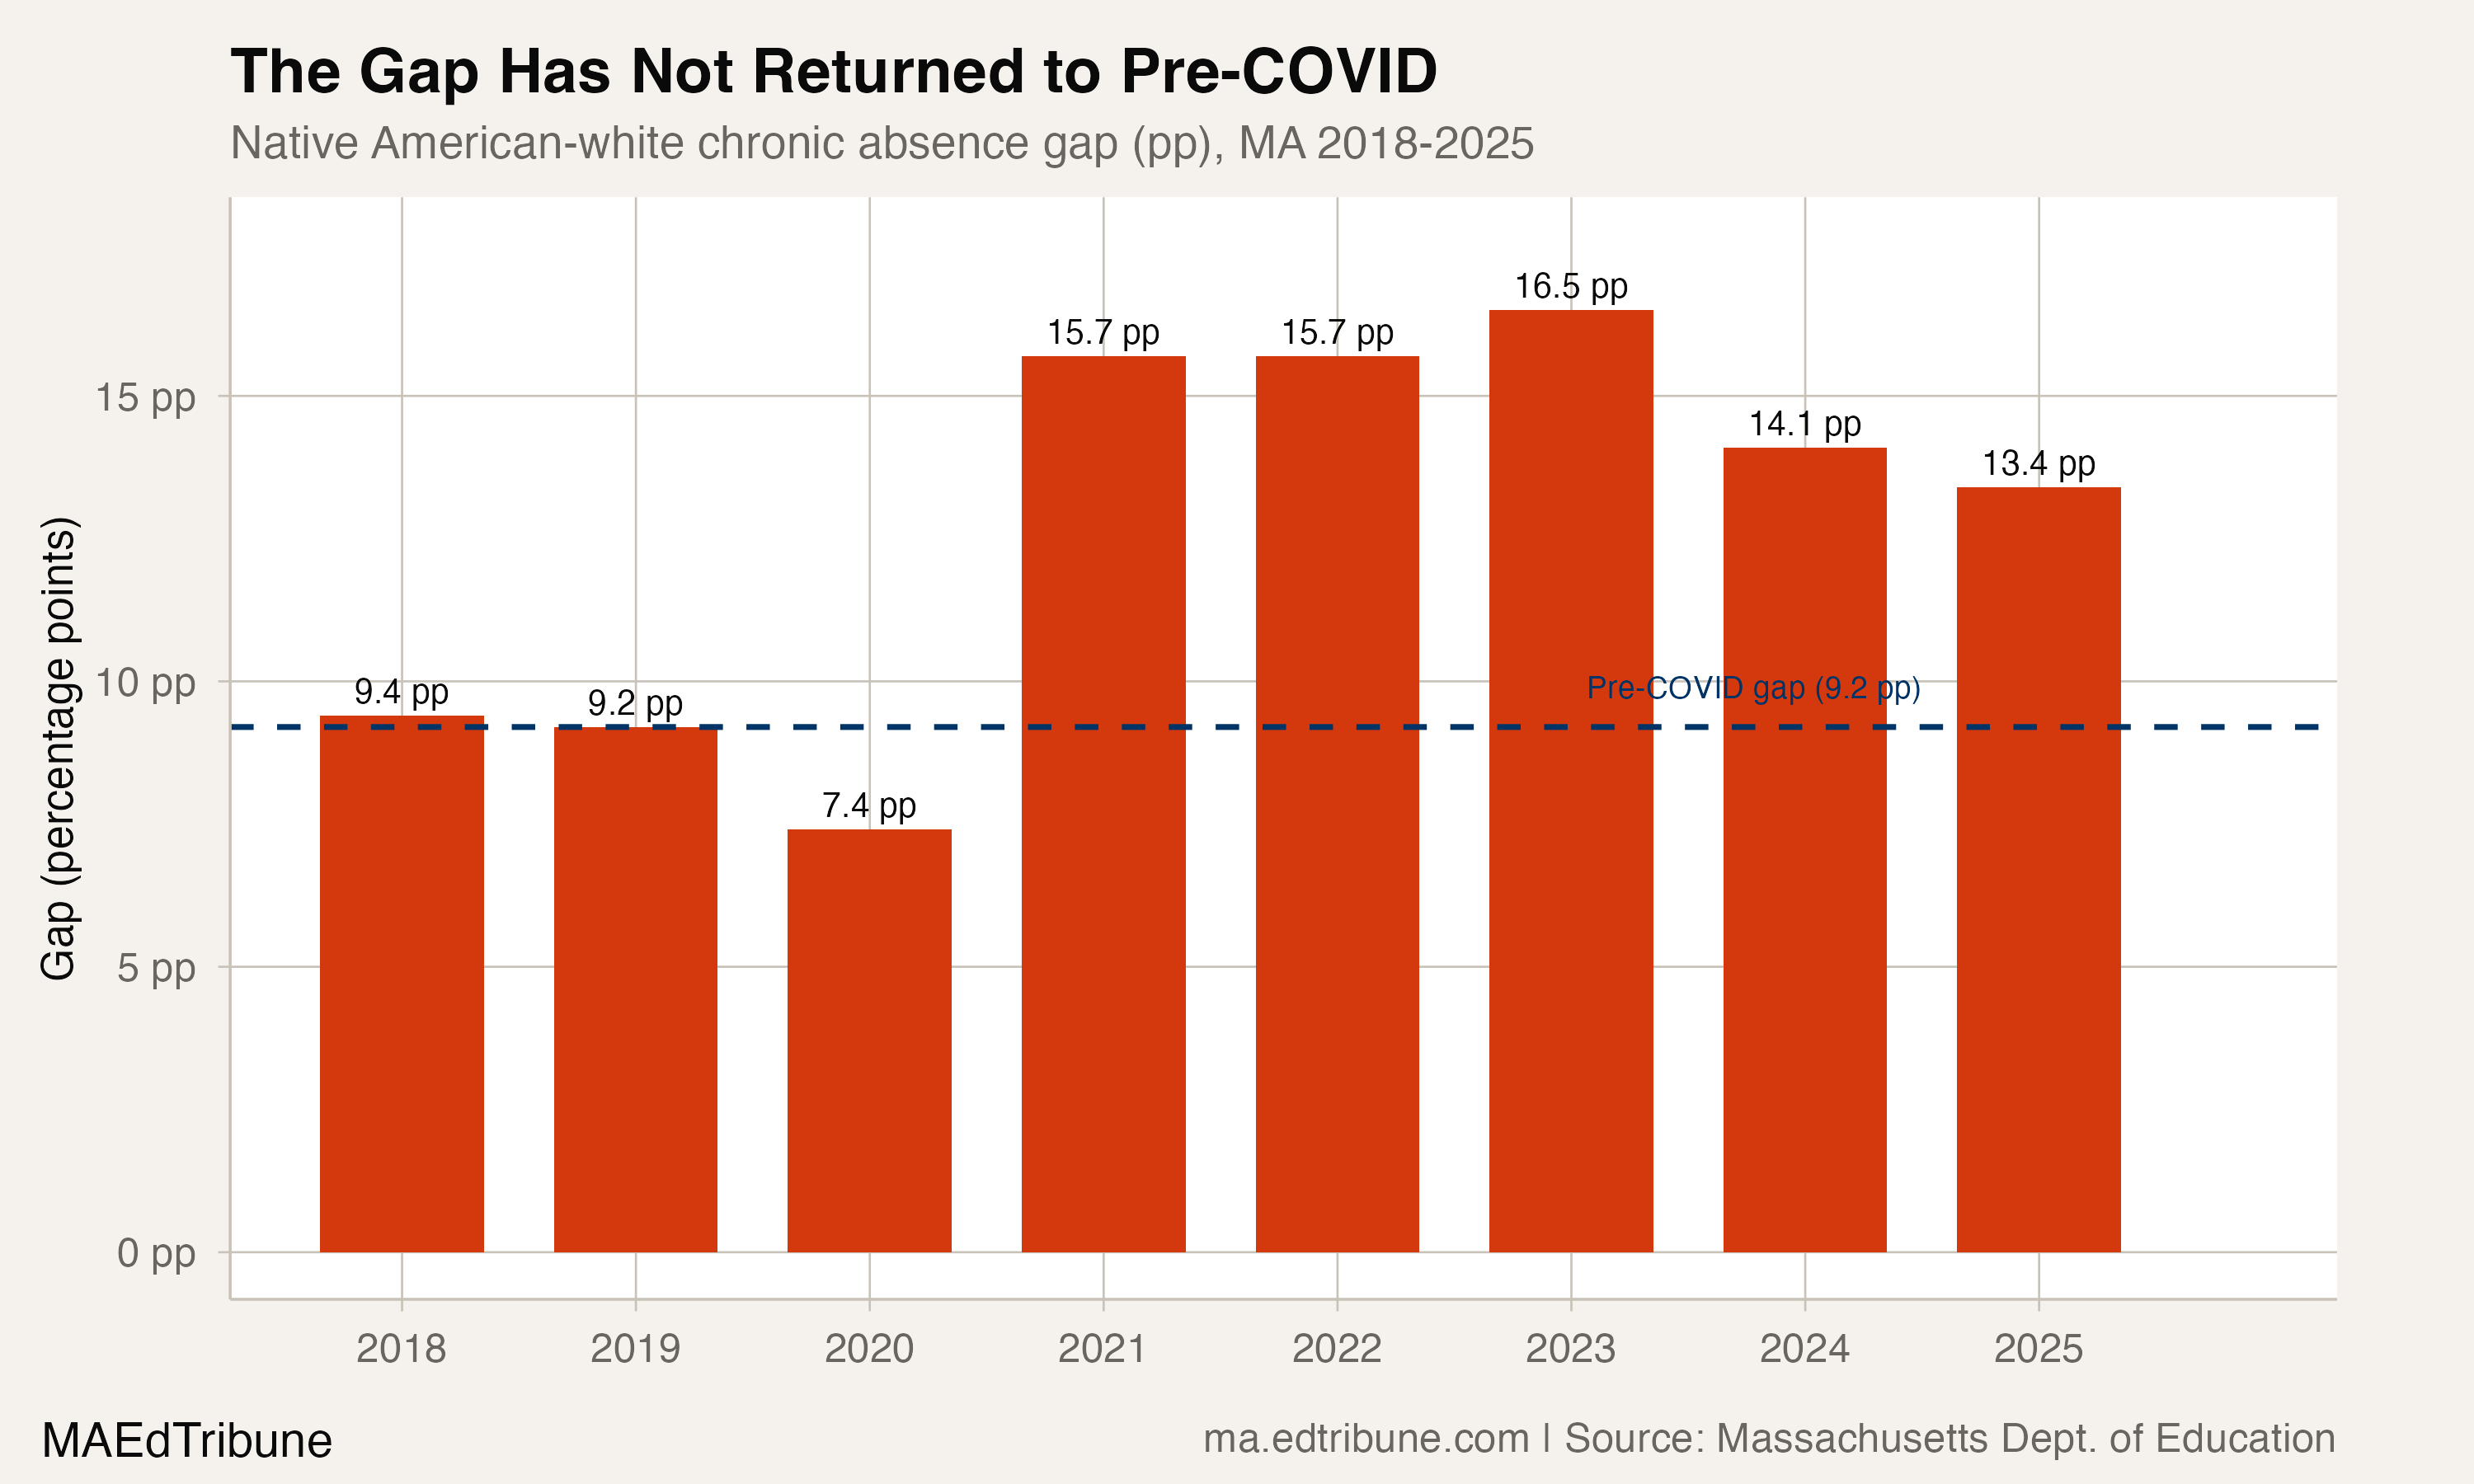
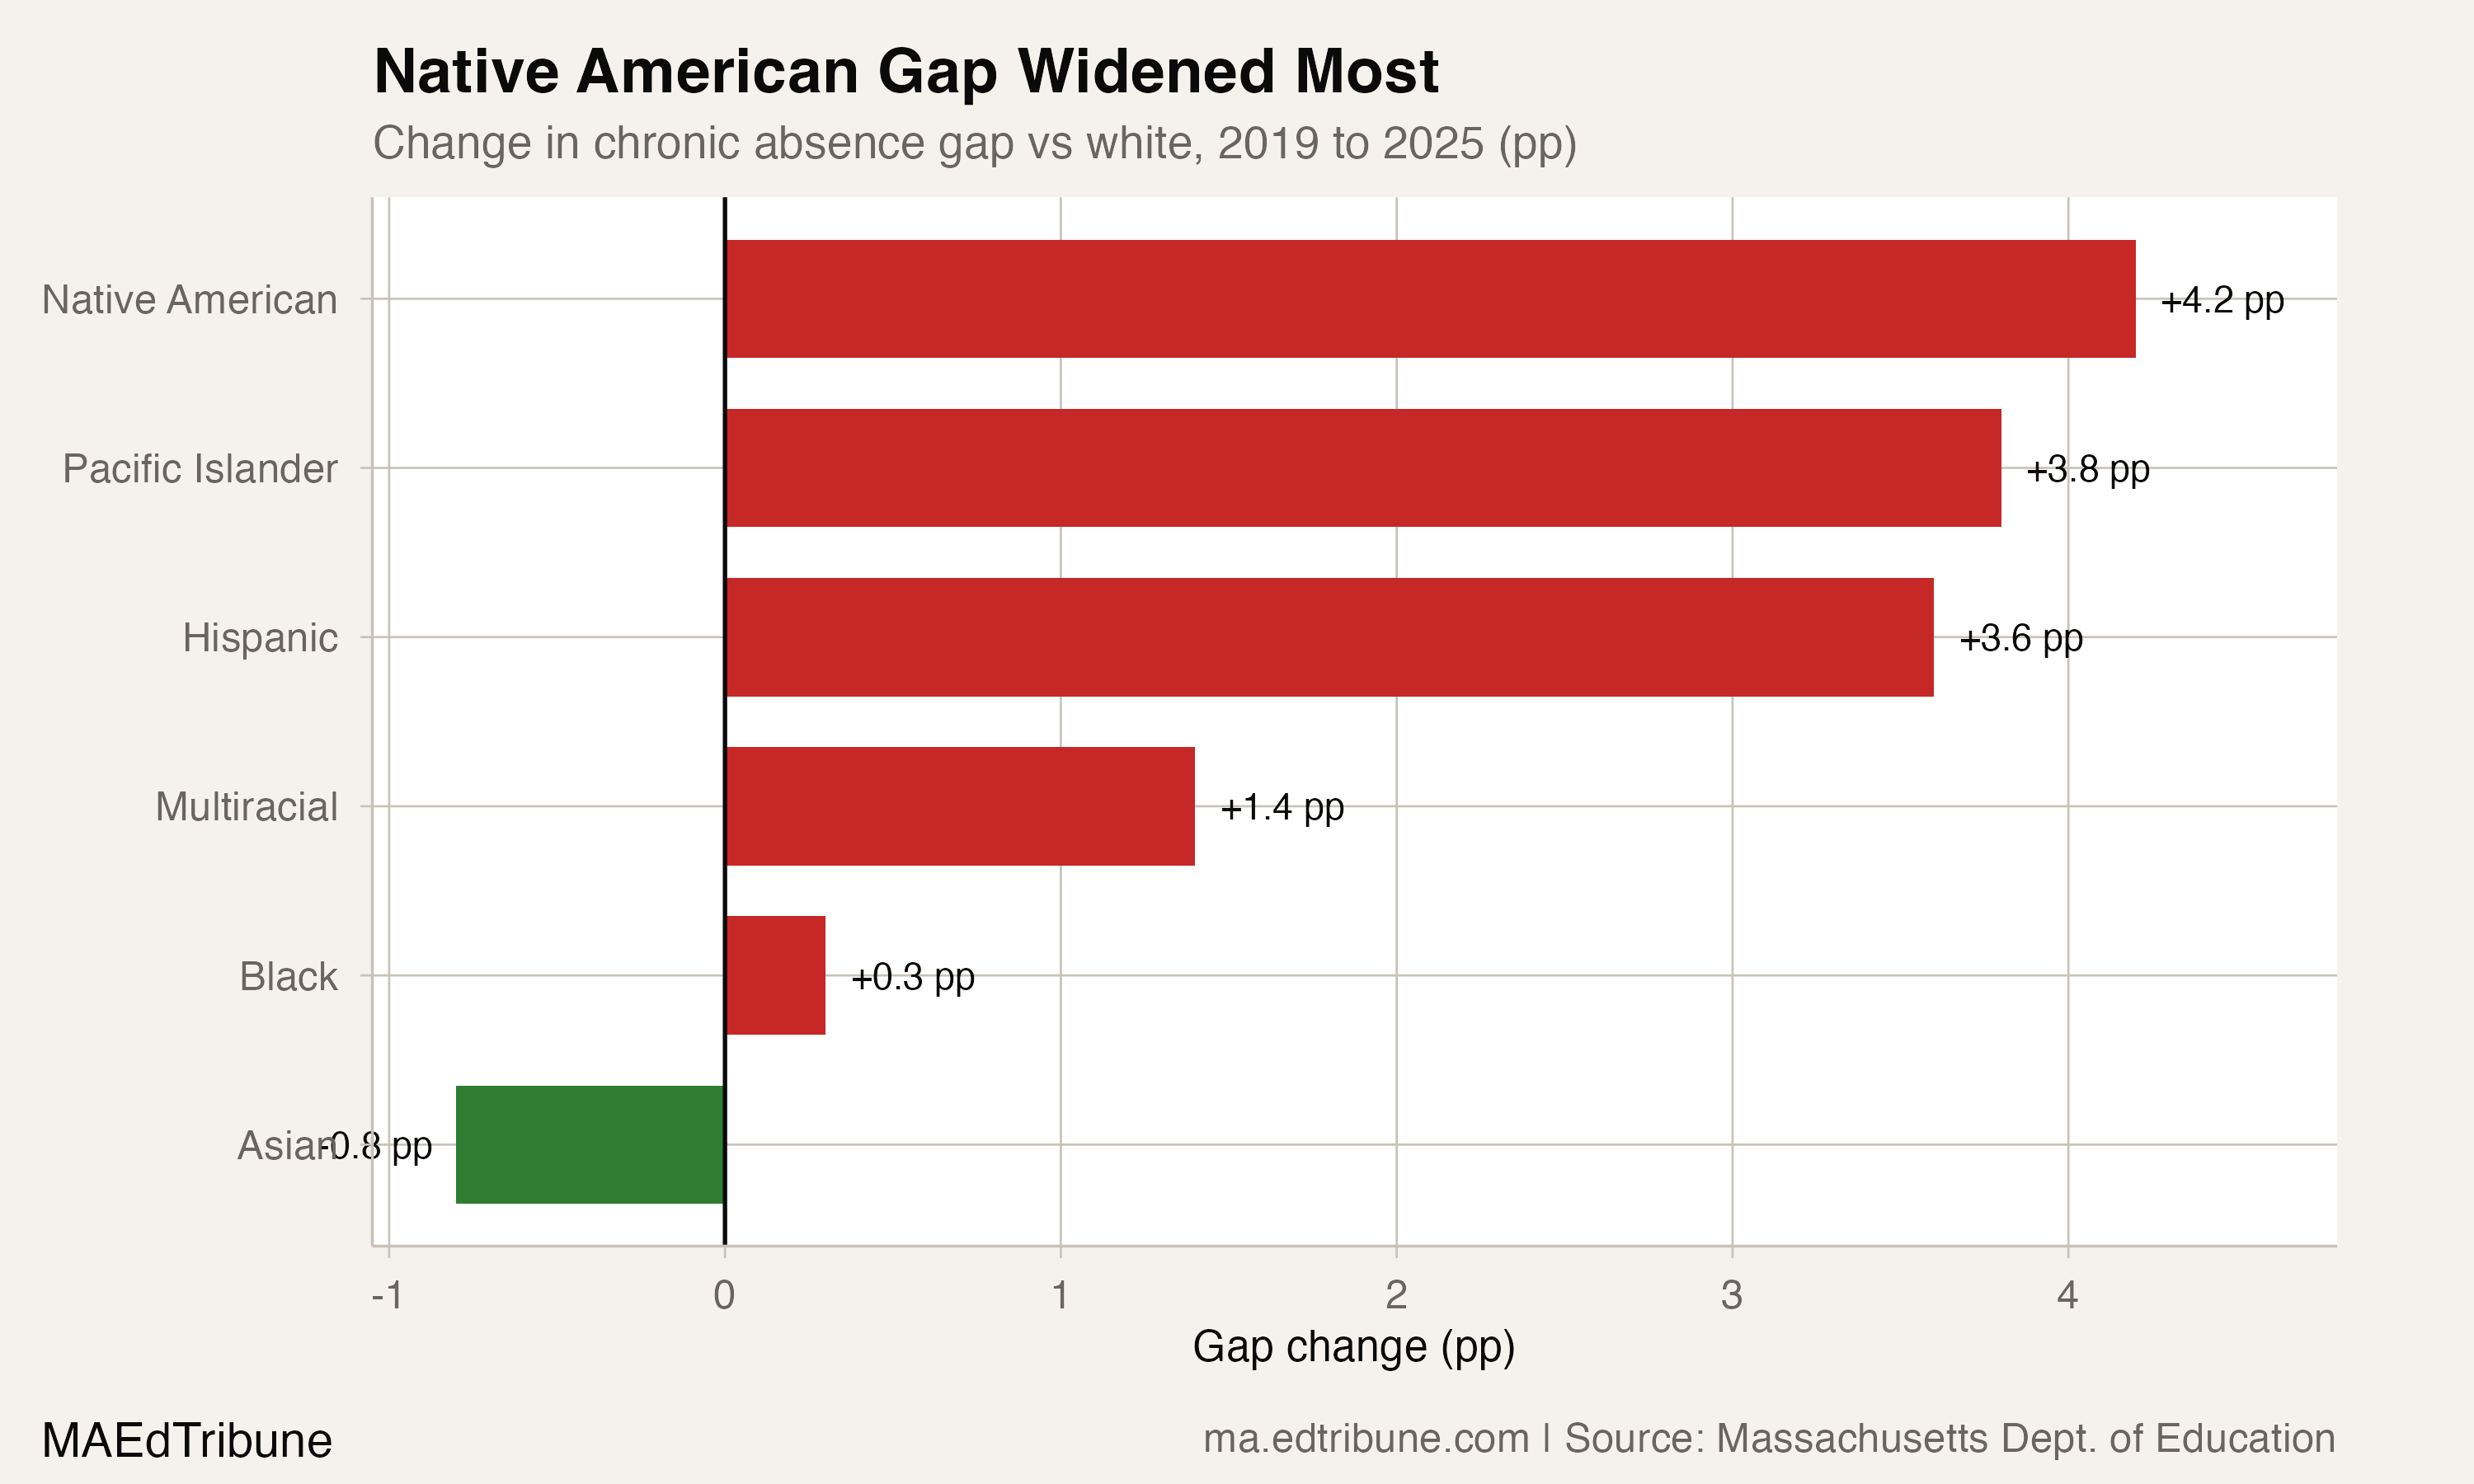
In 2019, the two rates were 18.9% and 9.7%, a 9.2-point gap. The gap therefore widened by 4.2 points through 2025, the largest increase among the six race groups compared with the white rate.
The Pacific Islander-white gap widened by 3.8 points, the second-largest change. The Hispanic-white gap widened by 3.6 points, the multiracial-white gap by 1.4 and the Black-white gap by 0.3. The Asian-white difference moved 0.8 point in the opposite direction.
The Gap Remained Above Its Earlier Level
The Native American rate rose from 18.9% in 2019 to a 37.8% peak in 2022, then fell to 33.5% in 2023, 28.5% in 2024 and 27.3% in 2025. The white rate rose from 9.7% to 22.1% in 2022 before falling to 17.0%, 14.4% and 13.9%.
The Native American-white gap was 15.7 points in 2022, peaked at 16.5 in 2023, and narrowed to 14.1 in 2024 and 13.4 in 2025. The Native American rate fell 5.0 points in 2024 and 1.2 points in 2025.
The package's average-absence measure was 14.4 days for Native American students and 10.5 for white students in 2025, a 3.9-day difference. In 2019, those averages were 11.9 and 8.7 days, a 3.2-day difference.
Recovery Differed Across Groups
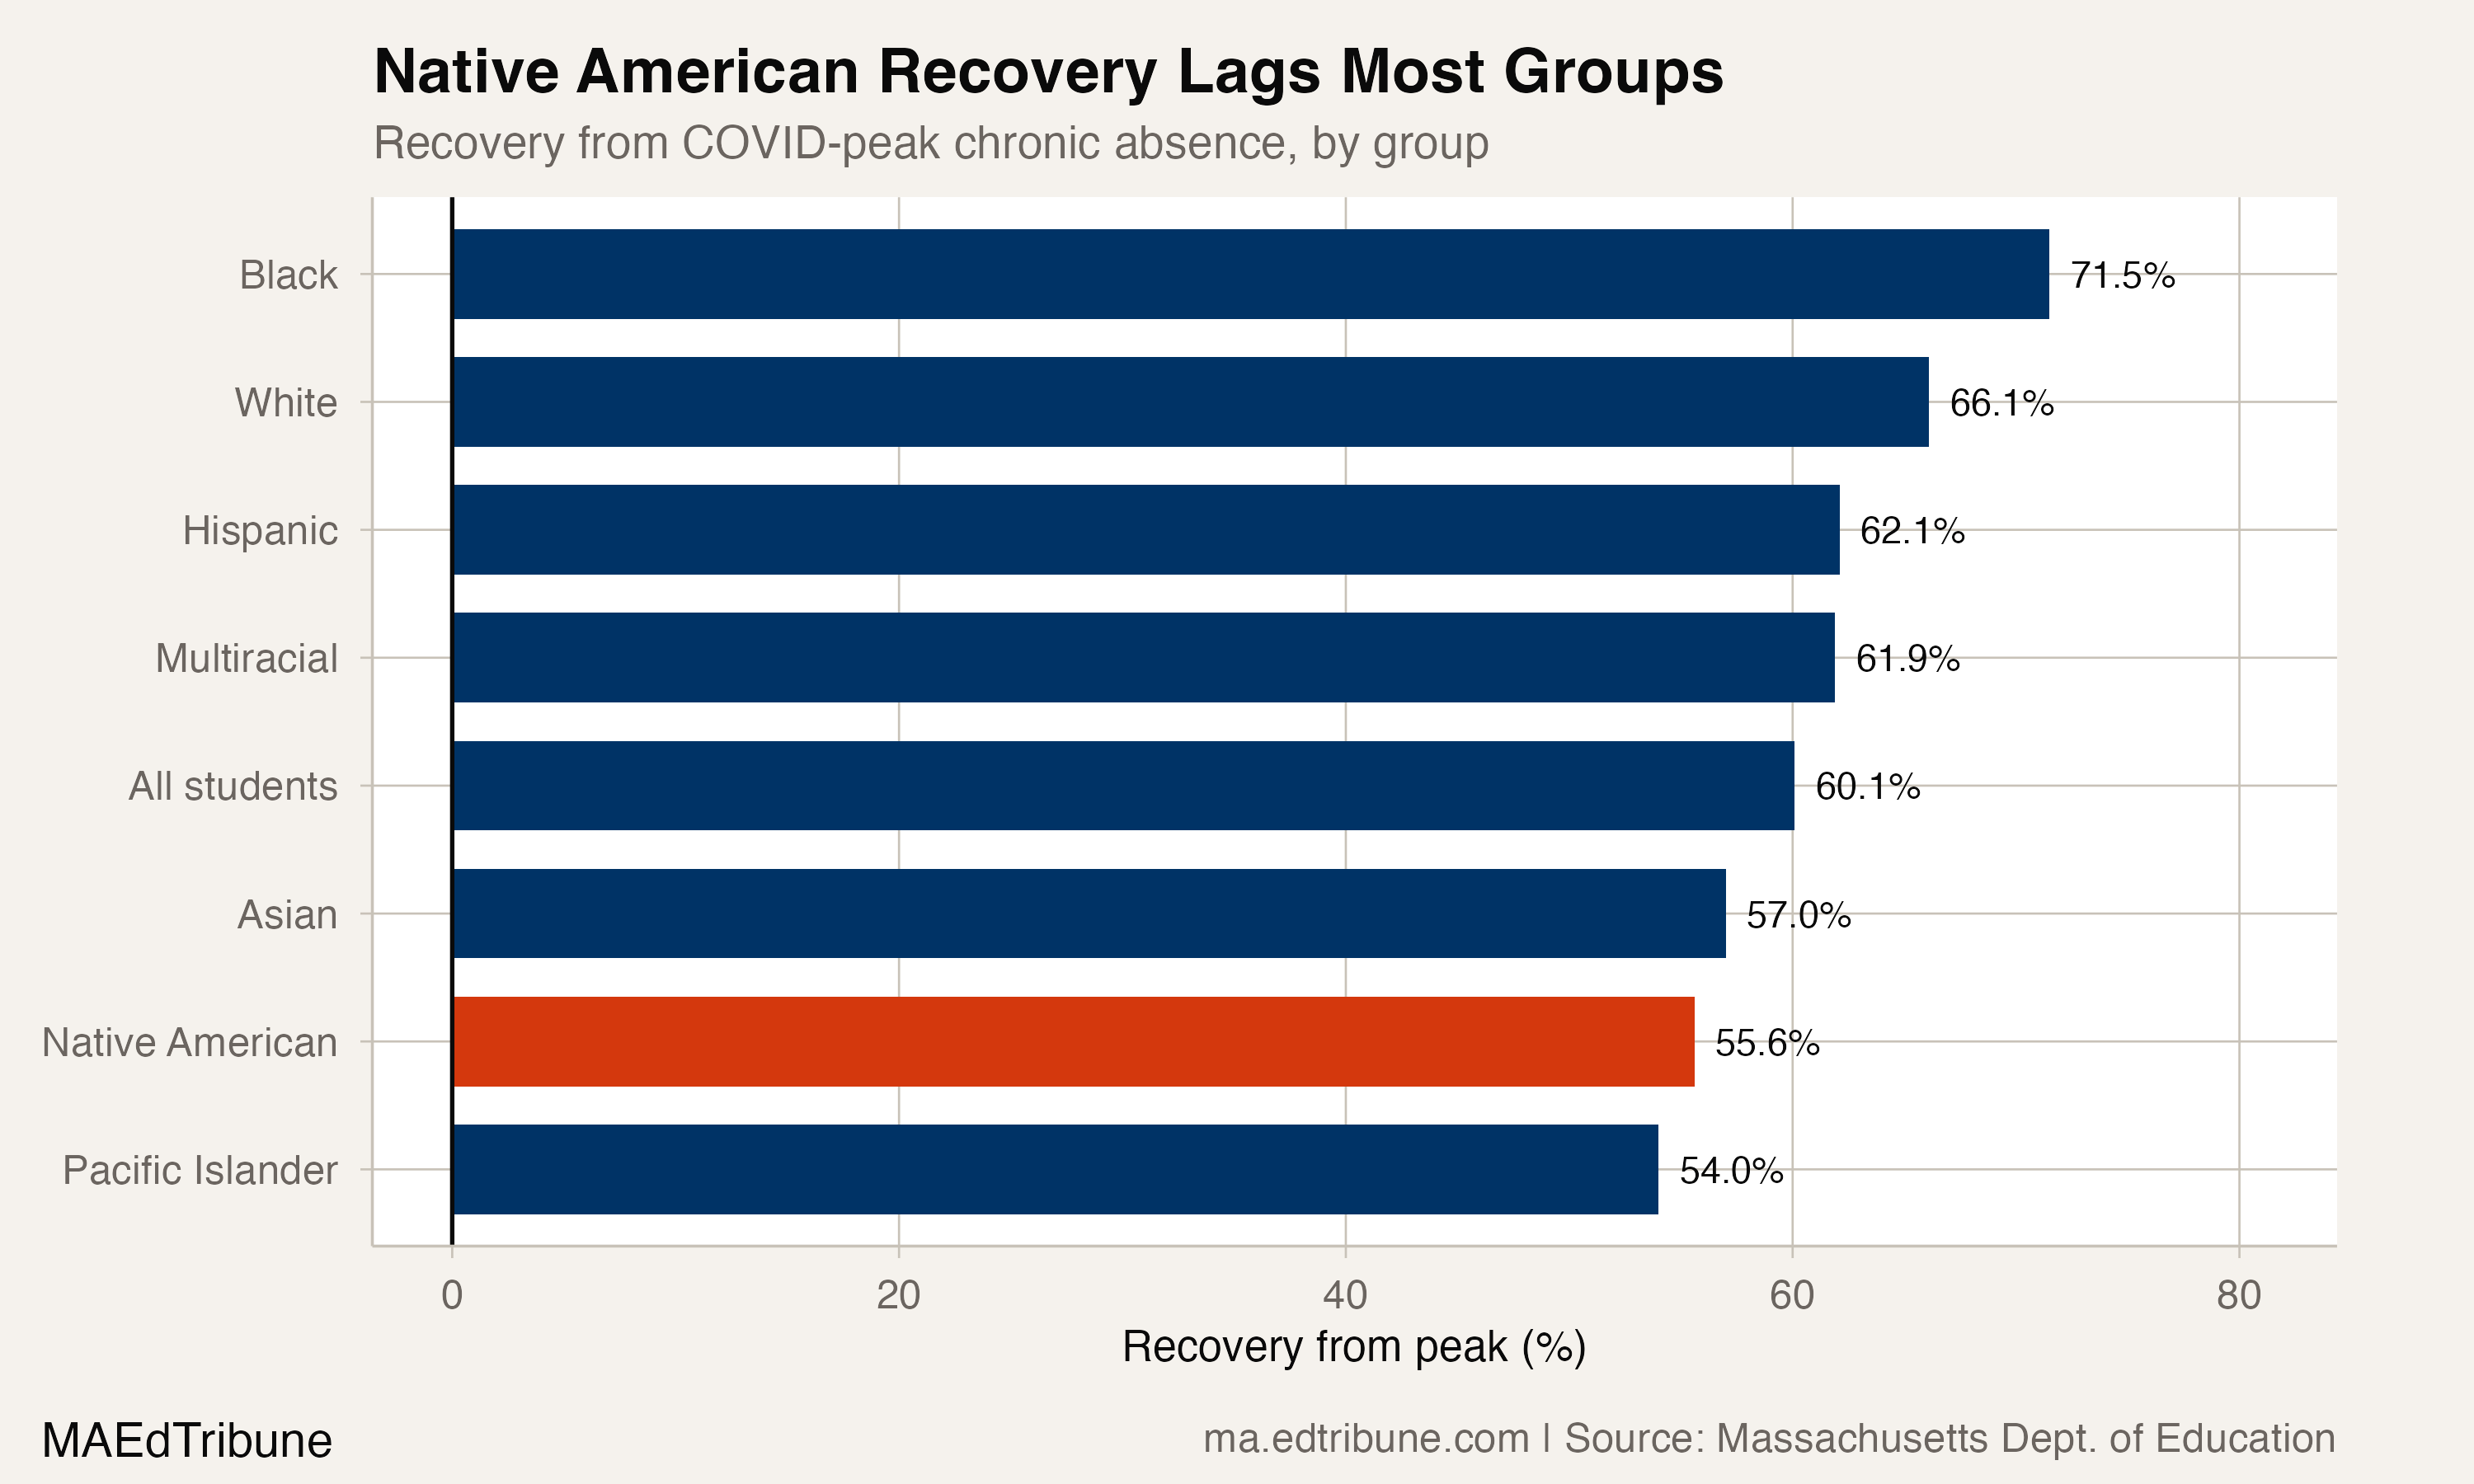
Recovery is calculated as the share of the increase from the 2019 rate to each group's 2022 peak that had been reversed by 2025. Pacific Islander students had the lowest recovery at 54.0%, followed by Native American students at 55.6% and Asian students at 57.0%.
The all-student rate recovered 60.1% of its increase. The white rate recovered 66.1%, and the Black rate recovered 71.5%.
District Results
The package reported Native American rates for 110 districts in 2025. All 110 also had a reported white rate, and 74, or 67.3%, had a higher Native American rate. The latest all-student district universe contained 395 district IDs, leaving 285 without a reported Native American rate. The file does not establish whether each missing value reflects suppression, no students or another reporting condition.
Boston↗ET reported 43.2% for Native American students and 17.6% for white students, a 25.6-point gap. Cambridge↗ET reported 50.0% and 15.7%, a 34.3-point gap.
Mashpee↗ET reported a 34.4% Native American rate and a 16.8% white rate in 2025, a 17.6-point gap. Its Native American series was 48.2% in both 2022 and 2023, fell to 25.0% in 2024 and rose to 34.4% in 2025.
The separate 2025-26 enrollment file reported 1,801 Native American students statewide, 0.2% of enrollment. That count does not provide district subgroup denominators for the 2025 absence rates, so the district comparisons should not be used to infer the number of affected students.
What the File Cannot Explain
The aggregate data documents rate differences and changes. It does not identify whether poverty, health, historical experience, school programs, agency mandates or attendance campaigns caused them. It also does not support a linear forecast from the latest one-year change.
Detailed code that reproduces the analysis and figures in this article is available exclusively to EdTribune subscribers.
Discussion
Sign in to join the discussion.
Loading comments...