In this series: Massachusetts Chronic Absenteeism.
Correction (July 22, 2026): An earlier version said English-learner chronic absenteeism dropped from 23.7% to 23.9%; it rose by 0.2 point. It also called the 2024-25 Lawrence-state gap the lowest in the series, but the 2020-21 gap was lower; said Lawrence had the highest peak among the nine peers, which the package data do not support; and said Lynn alone worsened in 2024-25, though Springfield also increased. External numeric and causal claims not established by the attendance file were removed.
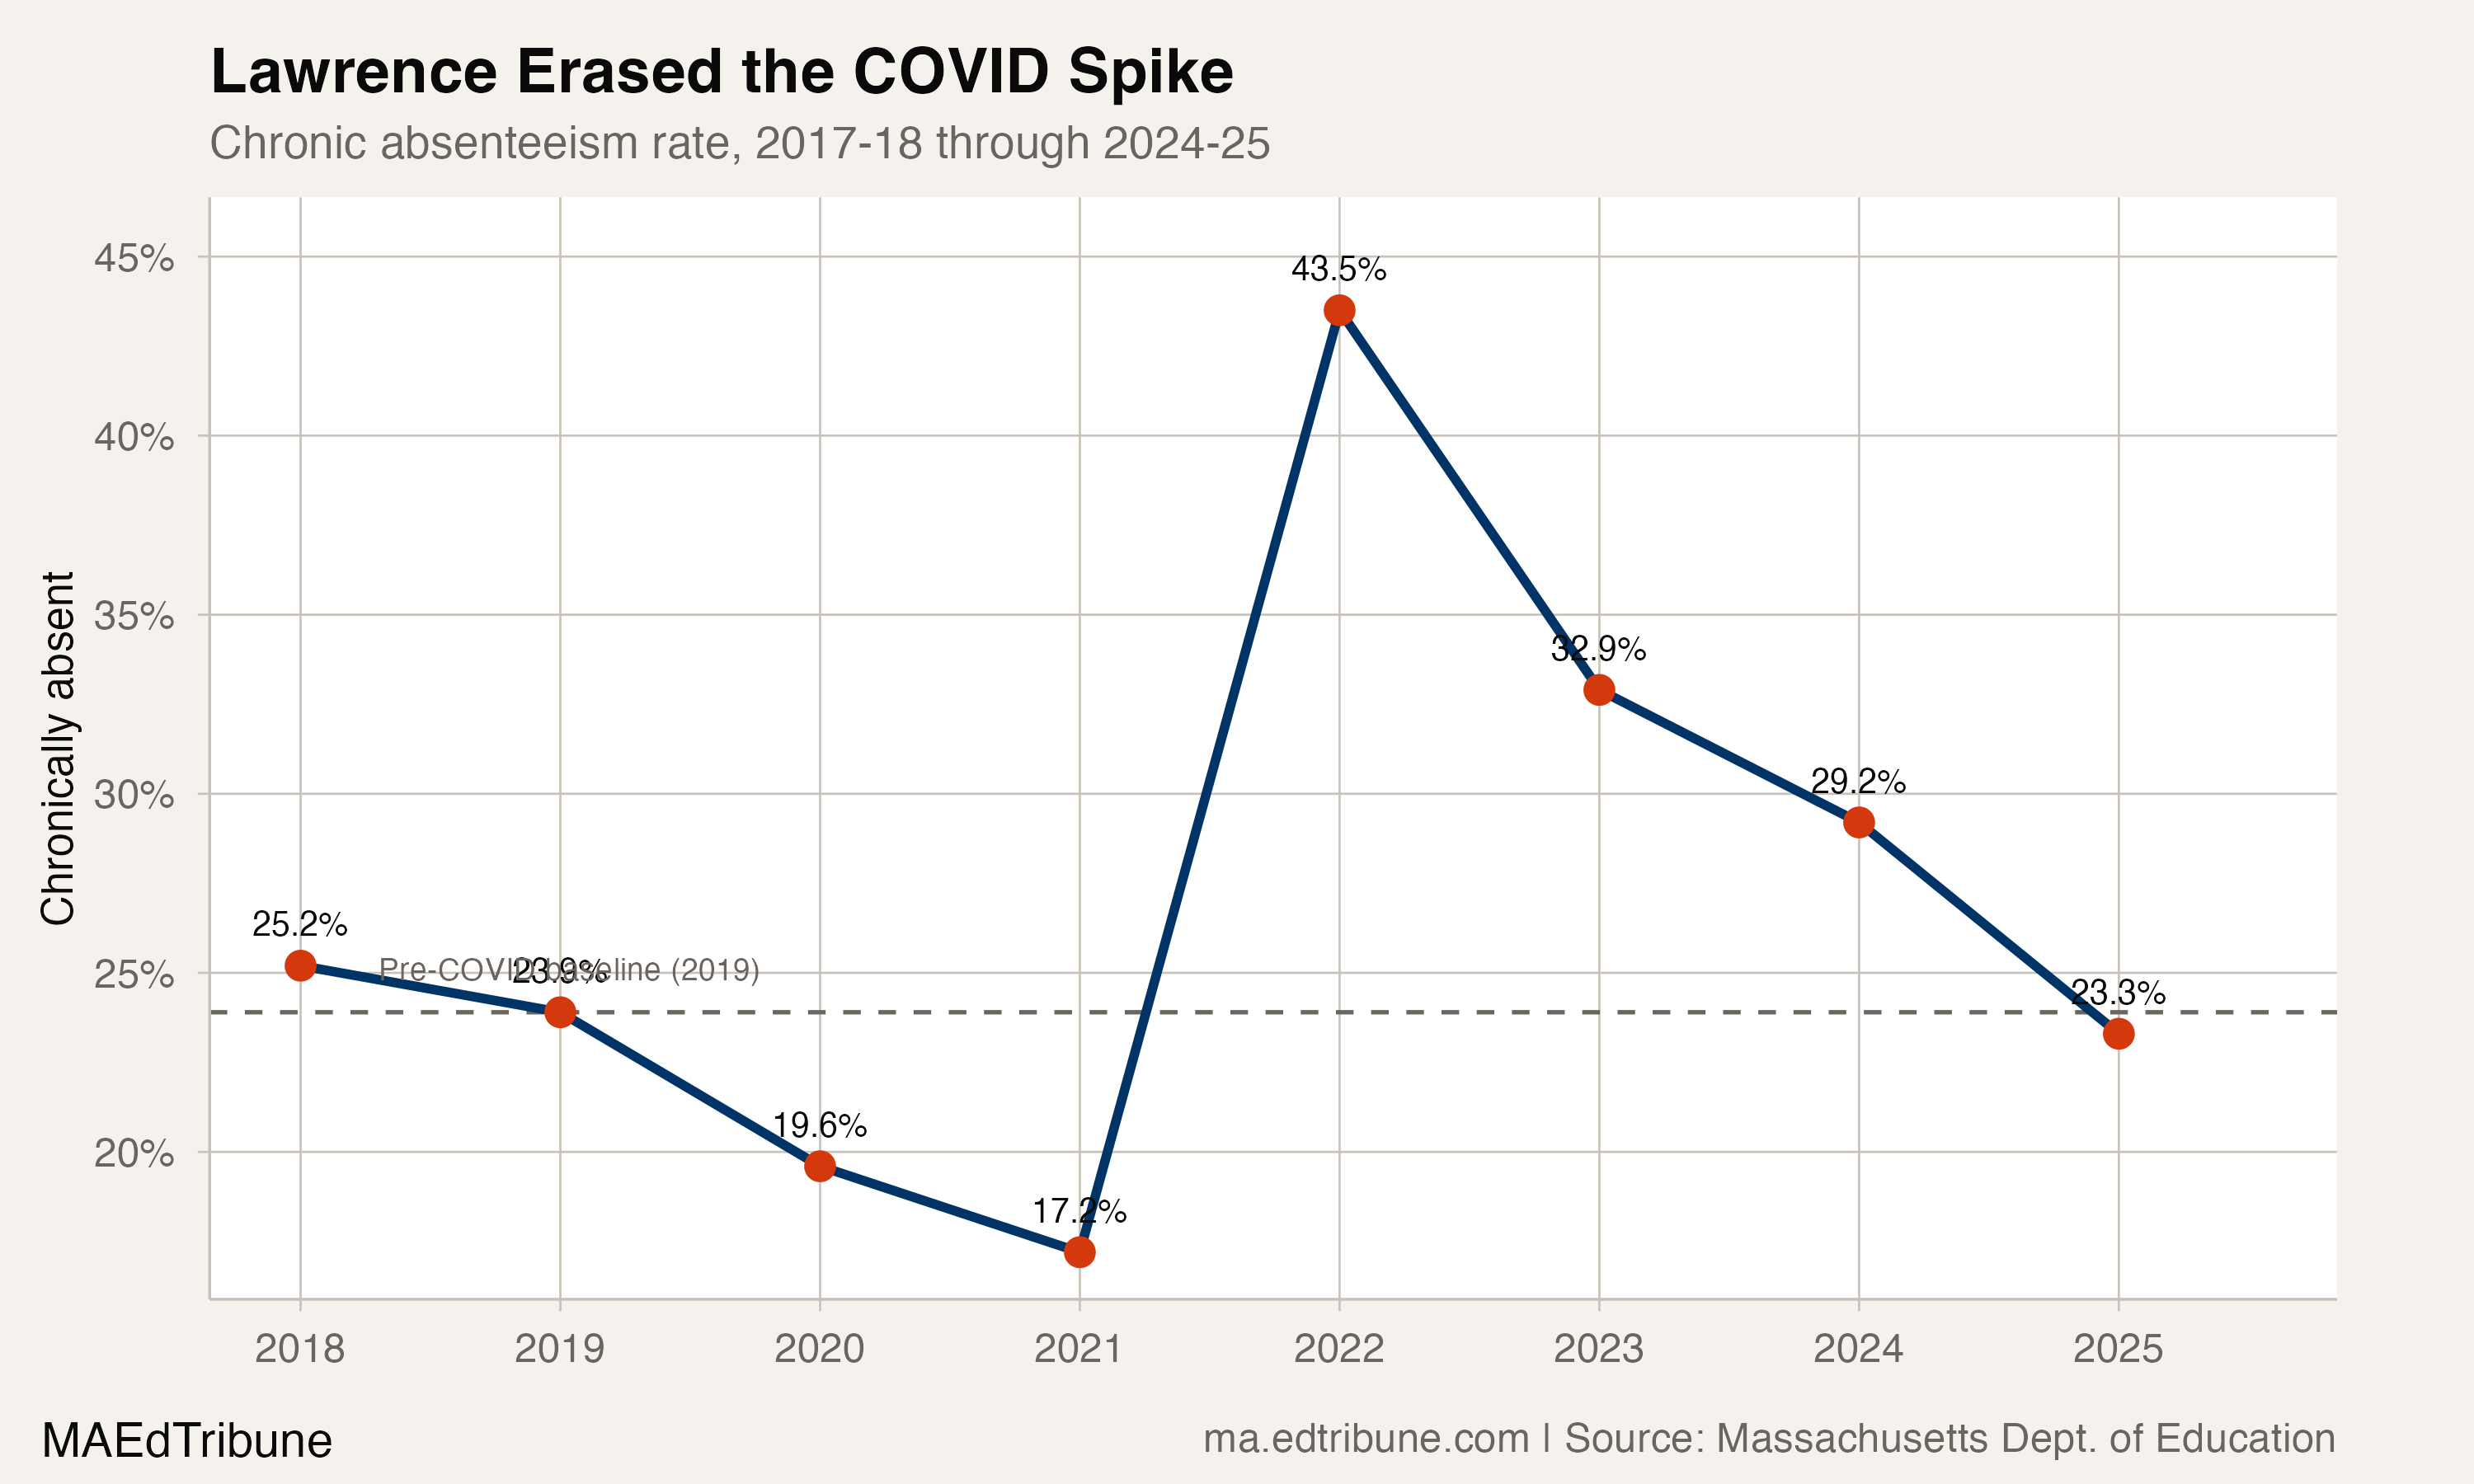
Lawrence↗ET cut its chronic absenteeism rate from a peak of 43.5% in 2021-22 to 23.3% in 2024-25, a 20.2-point drop that pushed the district 0.6 percentage points below its 2018-19 rate. Among the nine large Gateway Cities compared here, Lawrence is the only one to finish below its pre-COVID baseline.
Lynn↗ET went in the opposite direction. Its chronic absenteeism rate sits at 30.8%, a full 12.1 points above its pre-COVID baseline. Boston↗ET remains 7.8 points elevated. Springfield↗ET is 9.8 points above. Within the 26-city comparison used here, only Lawrence and Salem↗ET finished at or below their pre-pandemic levels. Salem fell 5.9 points below its baseline.
A district that was already improving
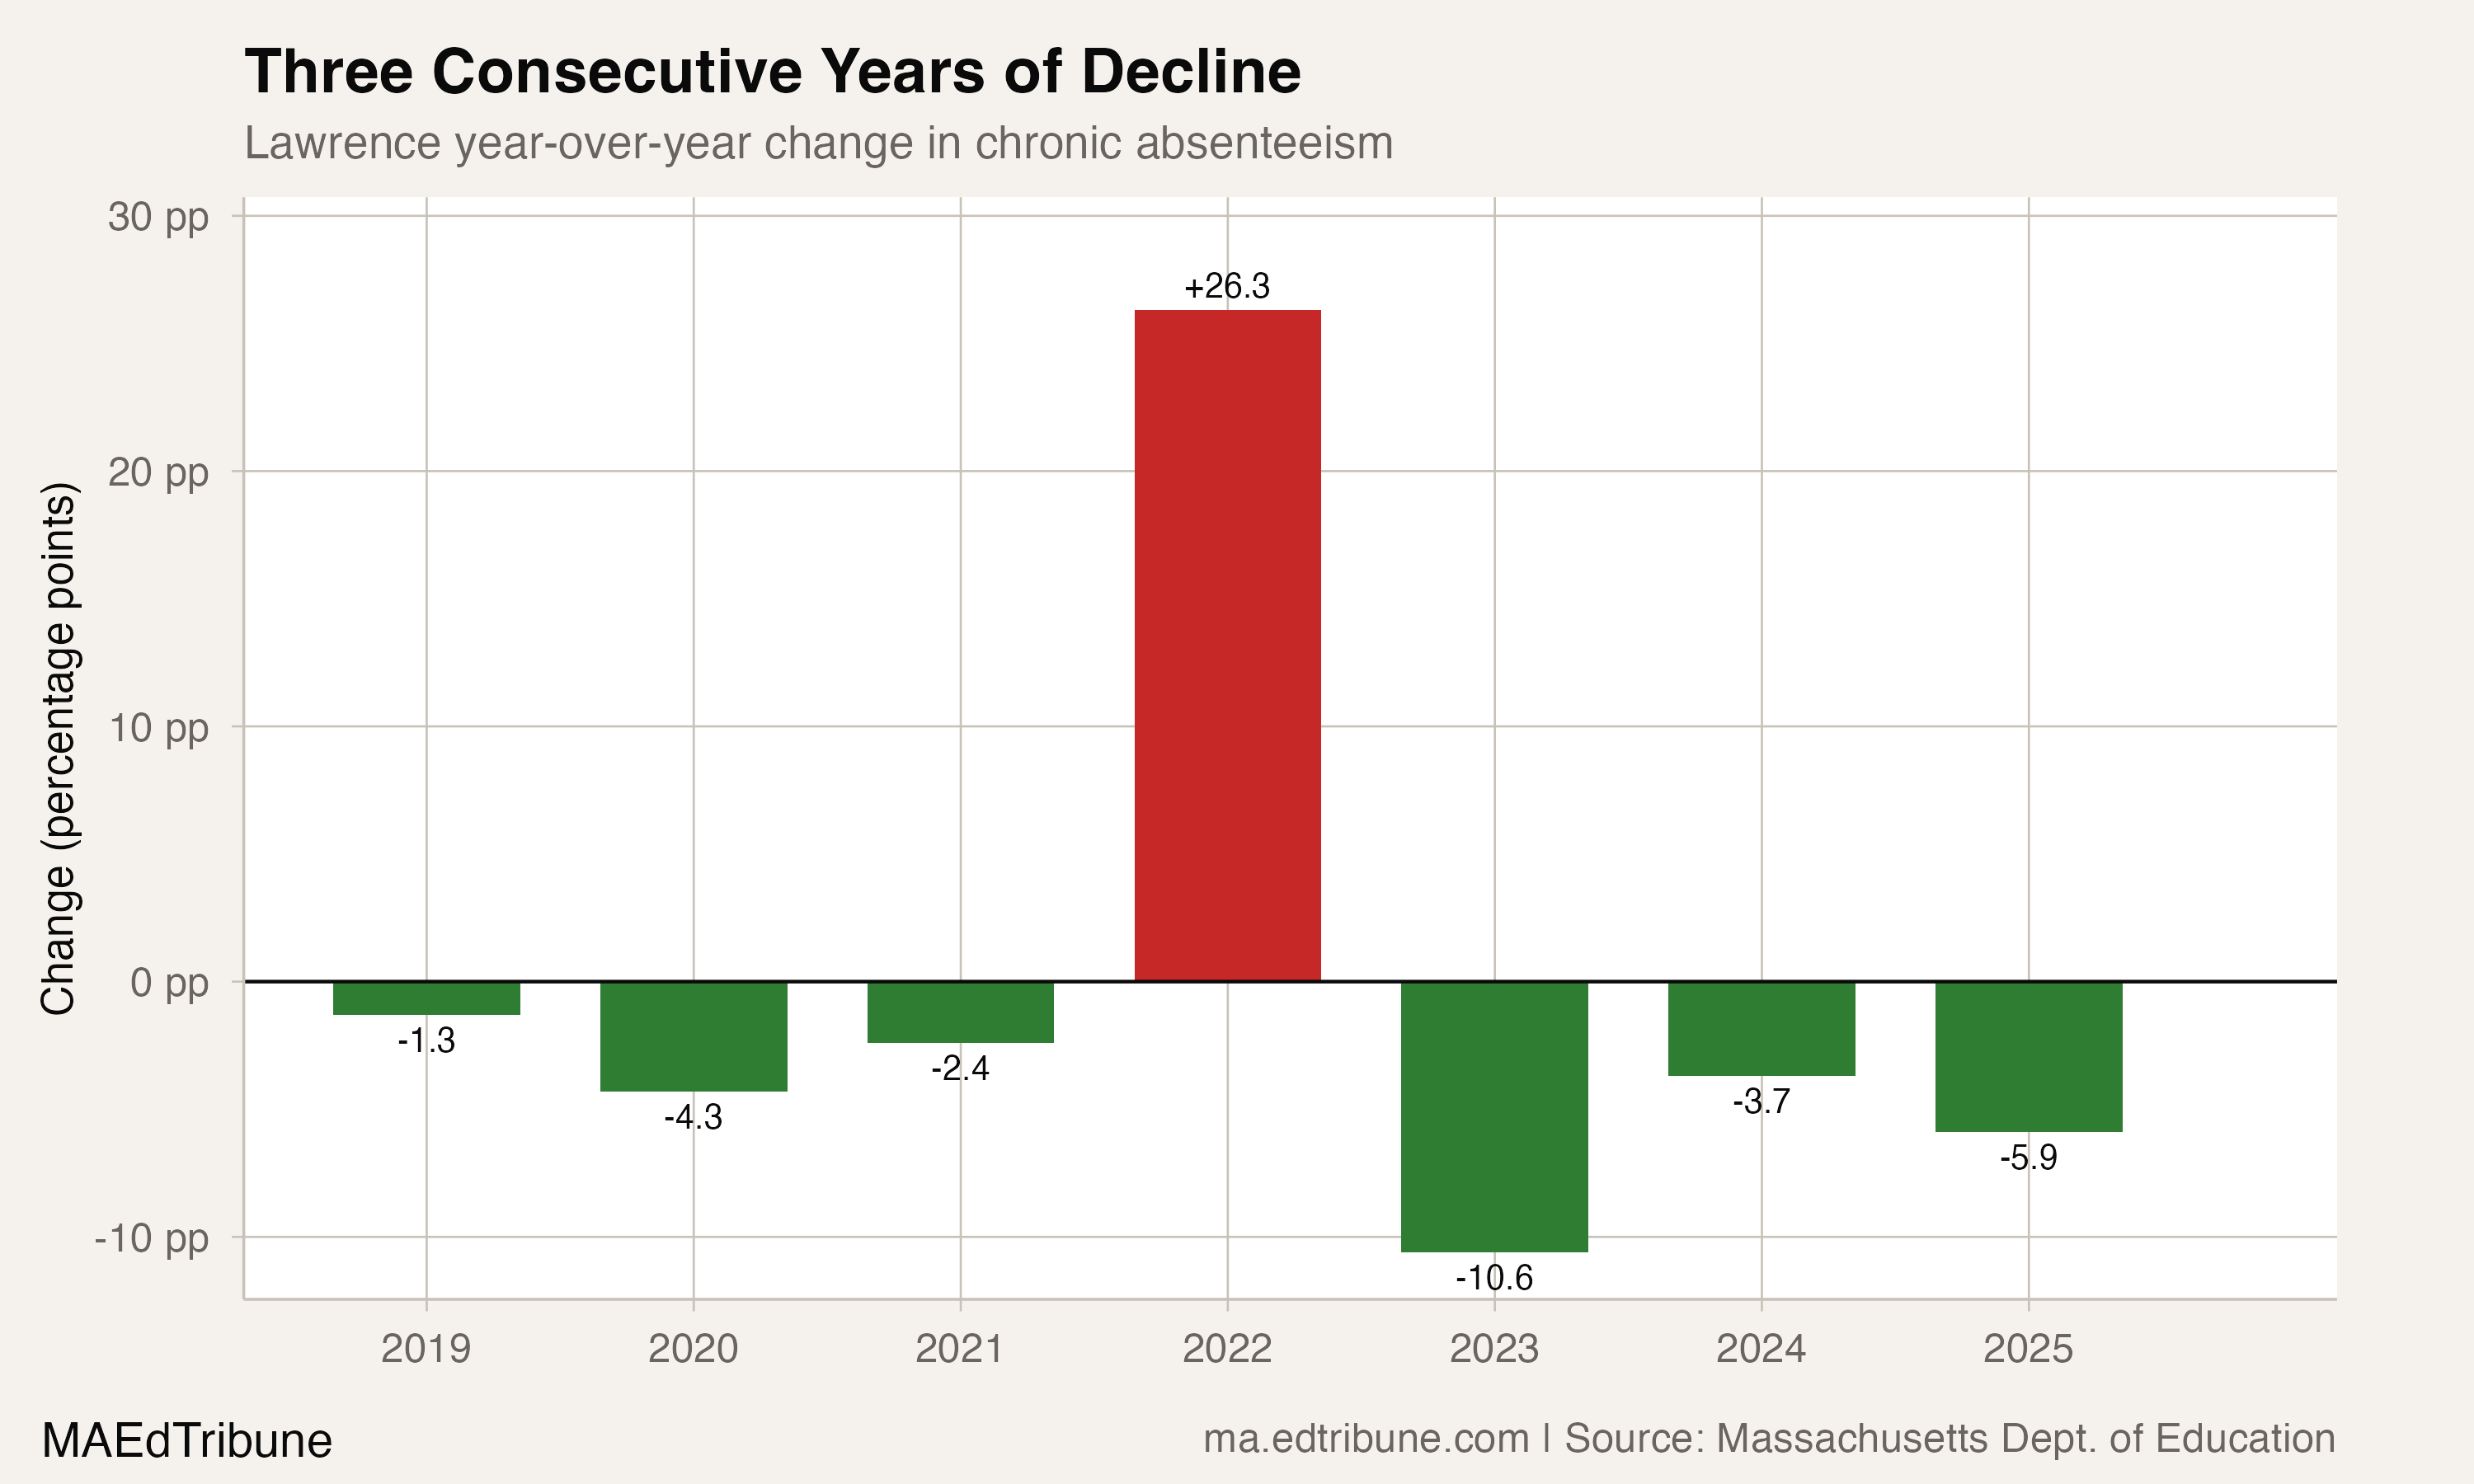
Lawrence's attendance gains did not begin with the recent recovery. Chronic absenteeism fell from 25.2% in 2017-18 to 19.6% in 2019-20, then to 17.2% in 2020-21. The rate then rose 26.3 points to 43.5% in 2021-22.
The district cut 10.6 points in 2022-23, then 3.7, then 5.9. The improvement accelerated in the most recent year, while the statewide one-year improvement slowed from 5.5 points in 2022-23 to 0.9 in 2024-25. The aggregate file establishes those trajectories but does not identify their causes.
The peer gap
The contrast between Lawrence and the other large Gateway Cities is not subtle.
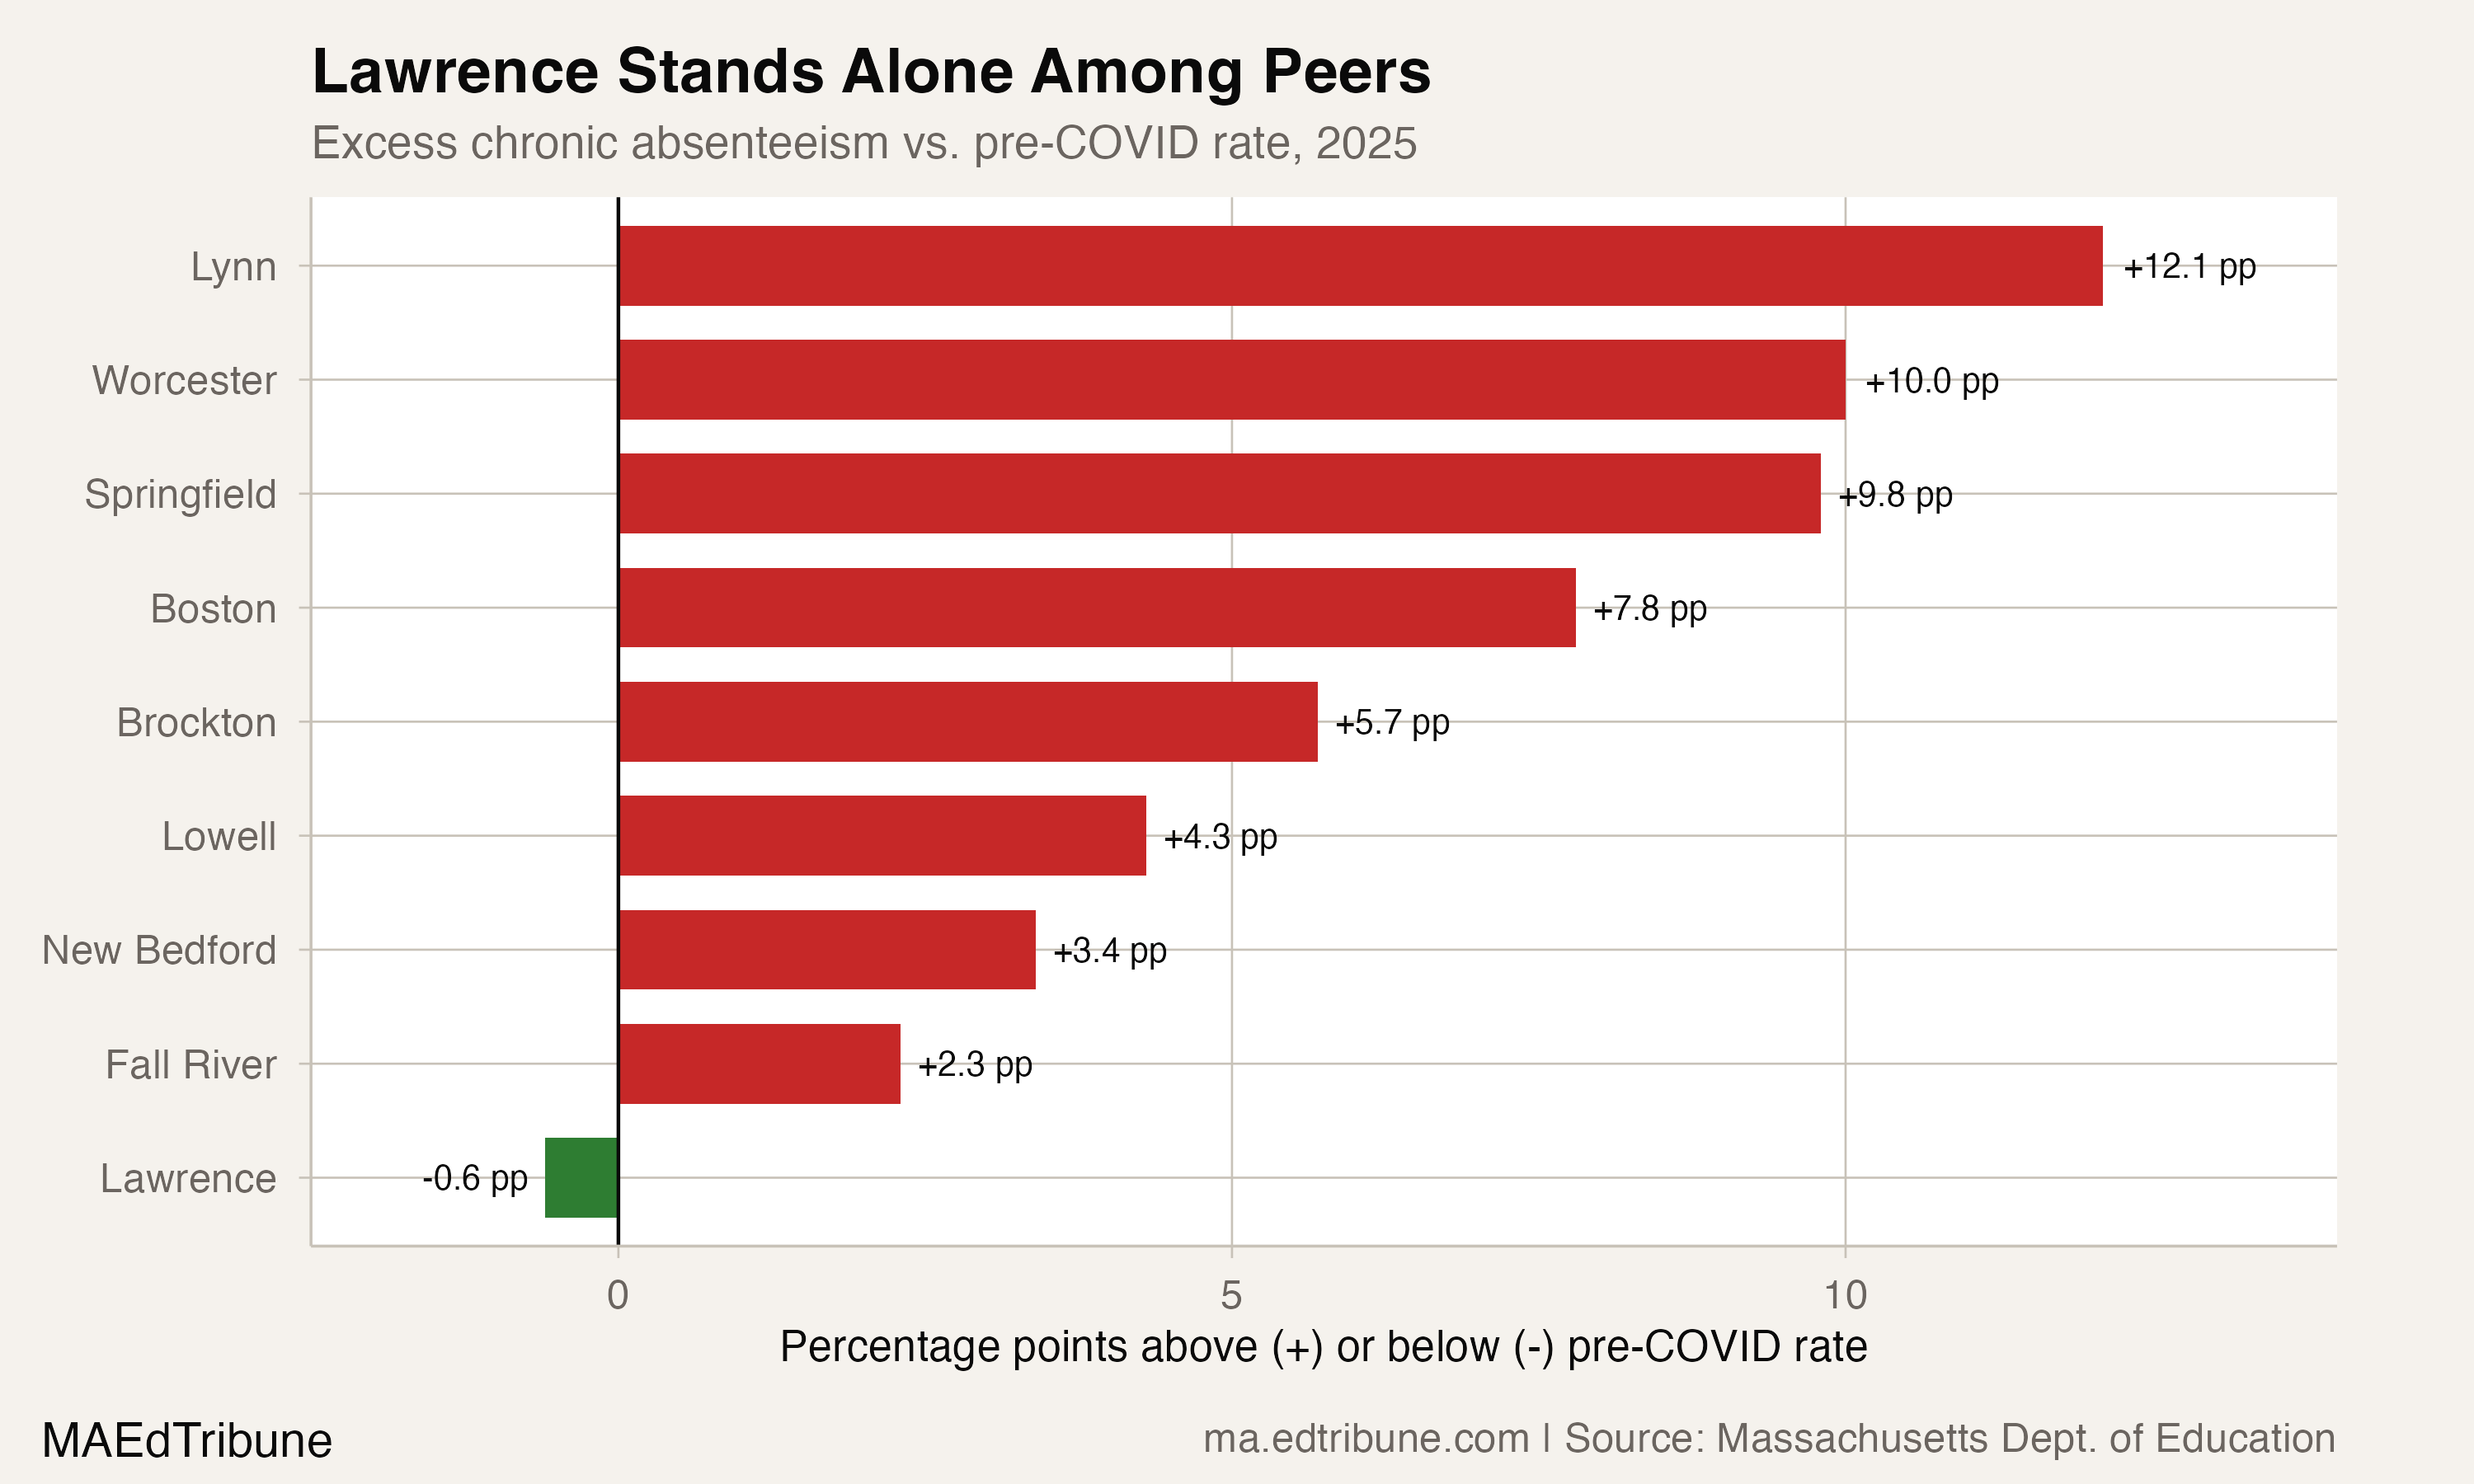
Fall River↗ET and New Bedford↗ET have recovered most of their COVID-era spike, sitting 2.3 and 3.4 points above their baselines. Lowell↗ET is 4.3 points elevated. Brockton↗ET is 5.7 points above.
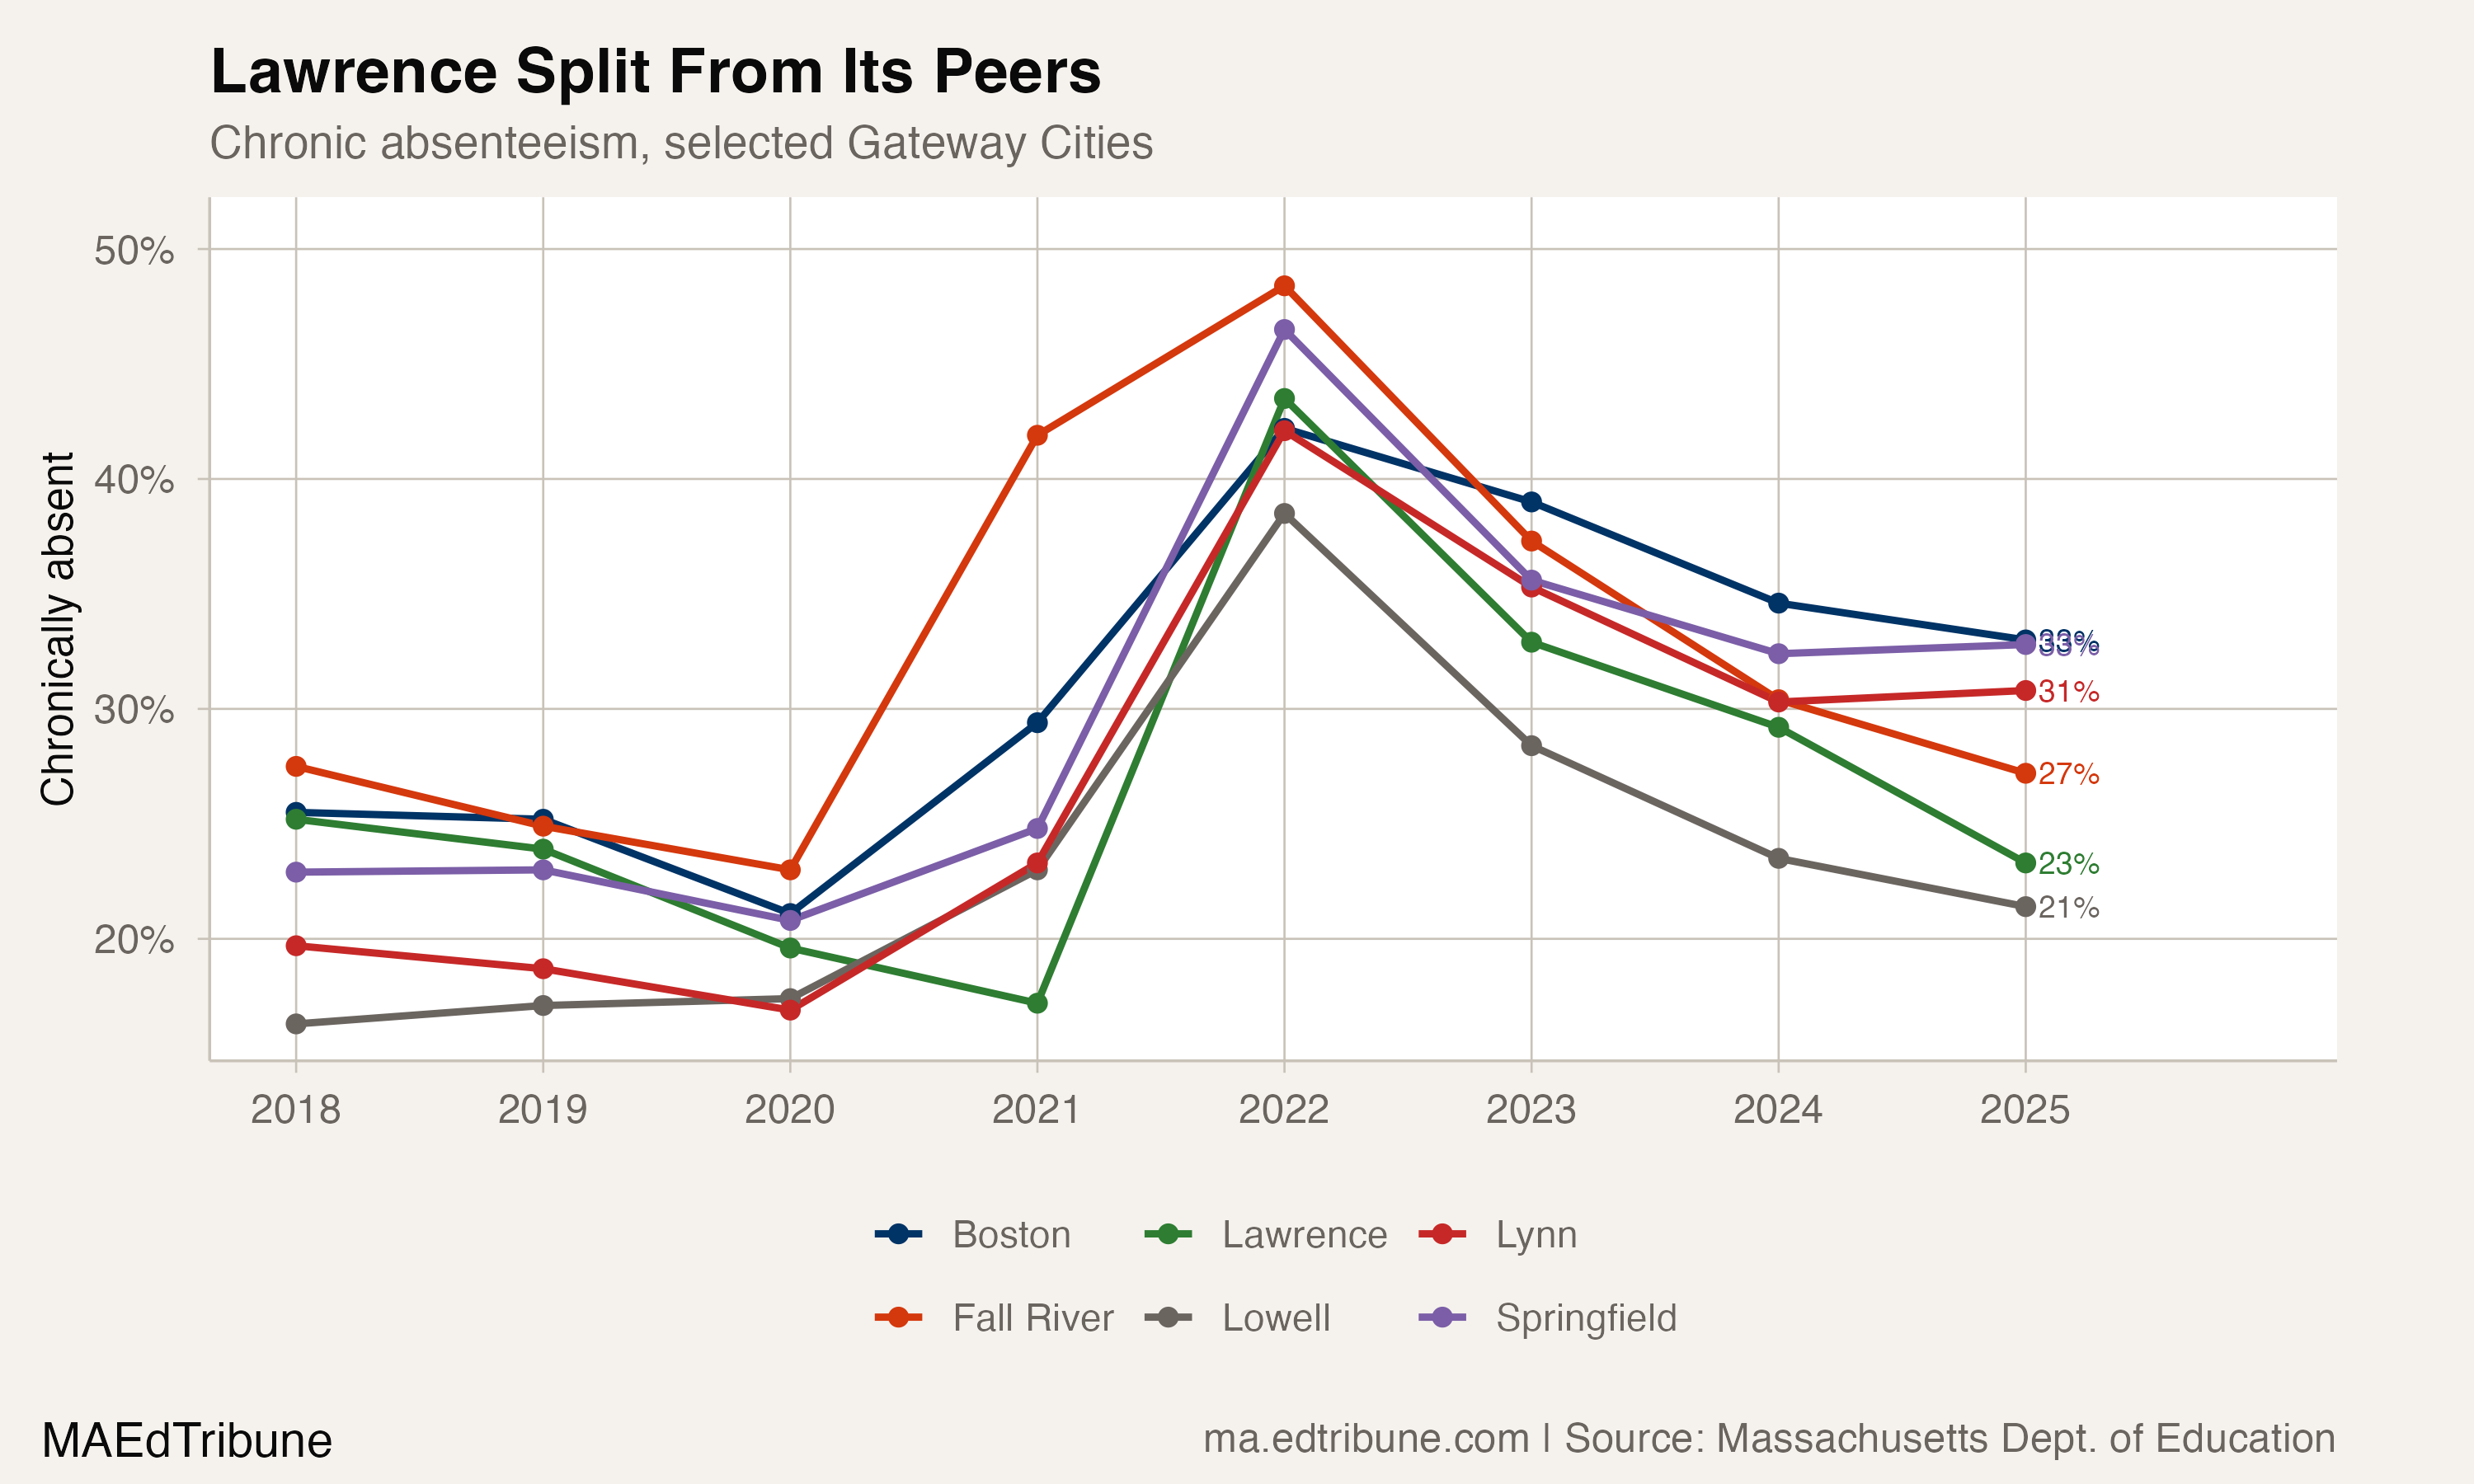
Then the gap widens. Boston's 33.0% rate is 7.8 points above pre-pandemic. Springfield, at 32.8%, is 9.8 points above its baseline. Worcester↗ET rose from 15.3% to 25.3%, a 10.0-point increase.
Lynn is the most concerning case. Its rate increased 0.5 point to 30.8% in 2024-25 after three years of post-peak improvement. Springfield also increased, by 0.4 point. Lynn's 12.1 points of excess above pre-COVID is the worst among the large gateways.
Inside Lawrence's numbers
Lawrence's overall 23.3% rate is nearly one in four students. The aggregate masks real variation. Special education students are chronically absent at 31.1%, down from 31.9% pre-COVID. White students, at 25.9%, remain 2.6 points above the district average.
Black students tell a different story entirely. Their chronic absenteeism rate dropped from 20.7% in 2018-19 to 14.8% in 2024-25, 5.9 points below the pre-COVID level. That is the largest improvement of any subgroup in the district.
Hispanic students track closely with the district average: 23.5% in 2024-25, down from 24.0% pre-COVID and a peak of 43.9%. English-learner chronic absenteeism rose from 23.7% to 23.9%, a 0.2-point change.
The gap between Lawrence and the state has also narrowed substantially. In 2018-19, Lawrence's chronic absence rate was 11.0 points above the statewide figure. By 2024-25, that gap had shrunk to 4.5 points. The gap was lower only in 2020-21, when Lawrence's rate was 0.5 point below the state rate.
What the data cannot answer
The district's recovery is real, but the aggregate attendance file cannot show why the rate changed or predict whether it will keep falling.
Detailed code that reproduces the analysis and figures in this article is available exclusively to EdTribune subscribers.
Discussion
Sign in to join the discussion.
Loading comments...