In this series: Massachusetts Chronic Absenteeism.
The day before school started in September 2025, Mayor Michelle Wu and Superintendent Mary Skipper knocked on doors in Jamaica Plain, Roxbury, and Dorchester. Seventy volunteers visited 184 homes of students with histories of chronic no-shows, handing out school supplies and gift cards, asking what it would take to get kids back in class. Emanuel Allen, director of BPS's Re-Engagement Center and a former high school dropout himself, told the volunteers that one conversation from a neighbor had gotten him back on track.
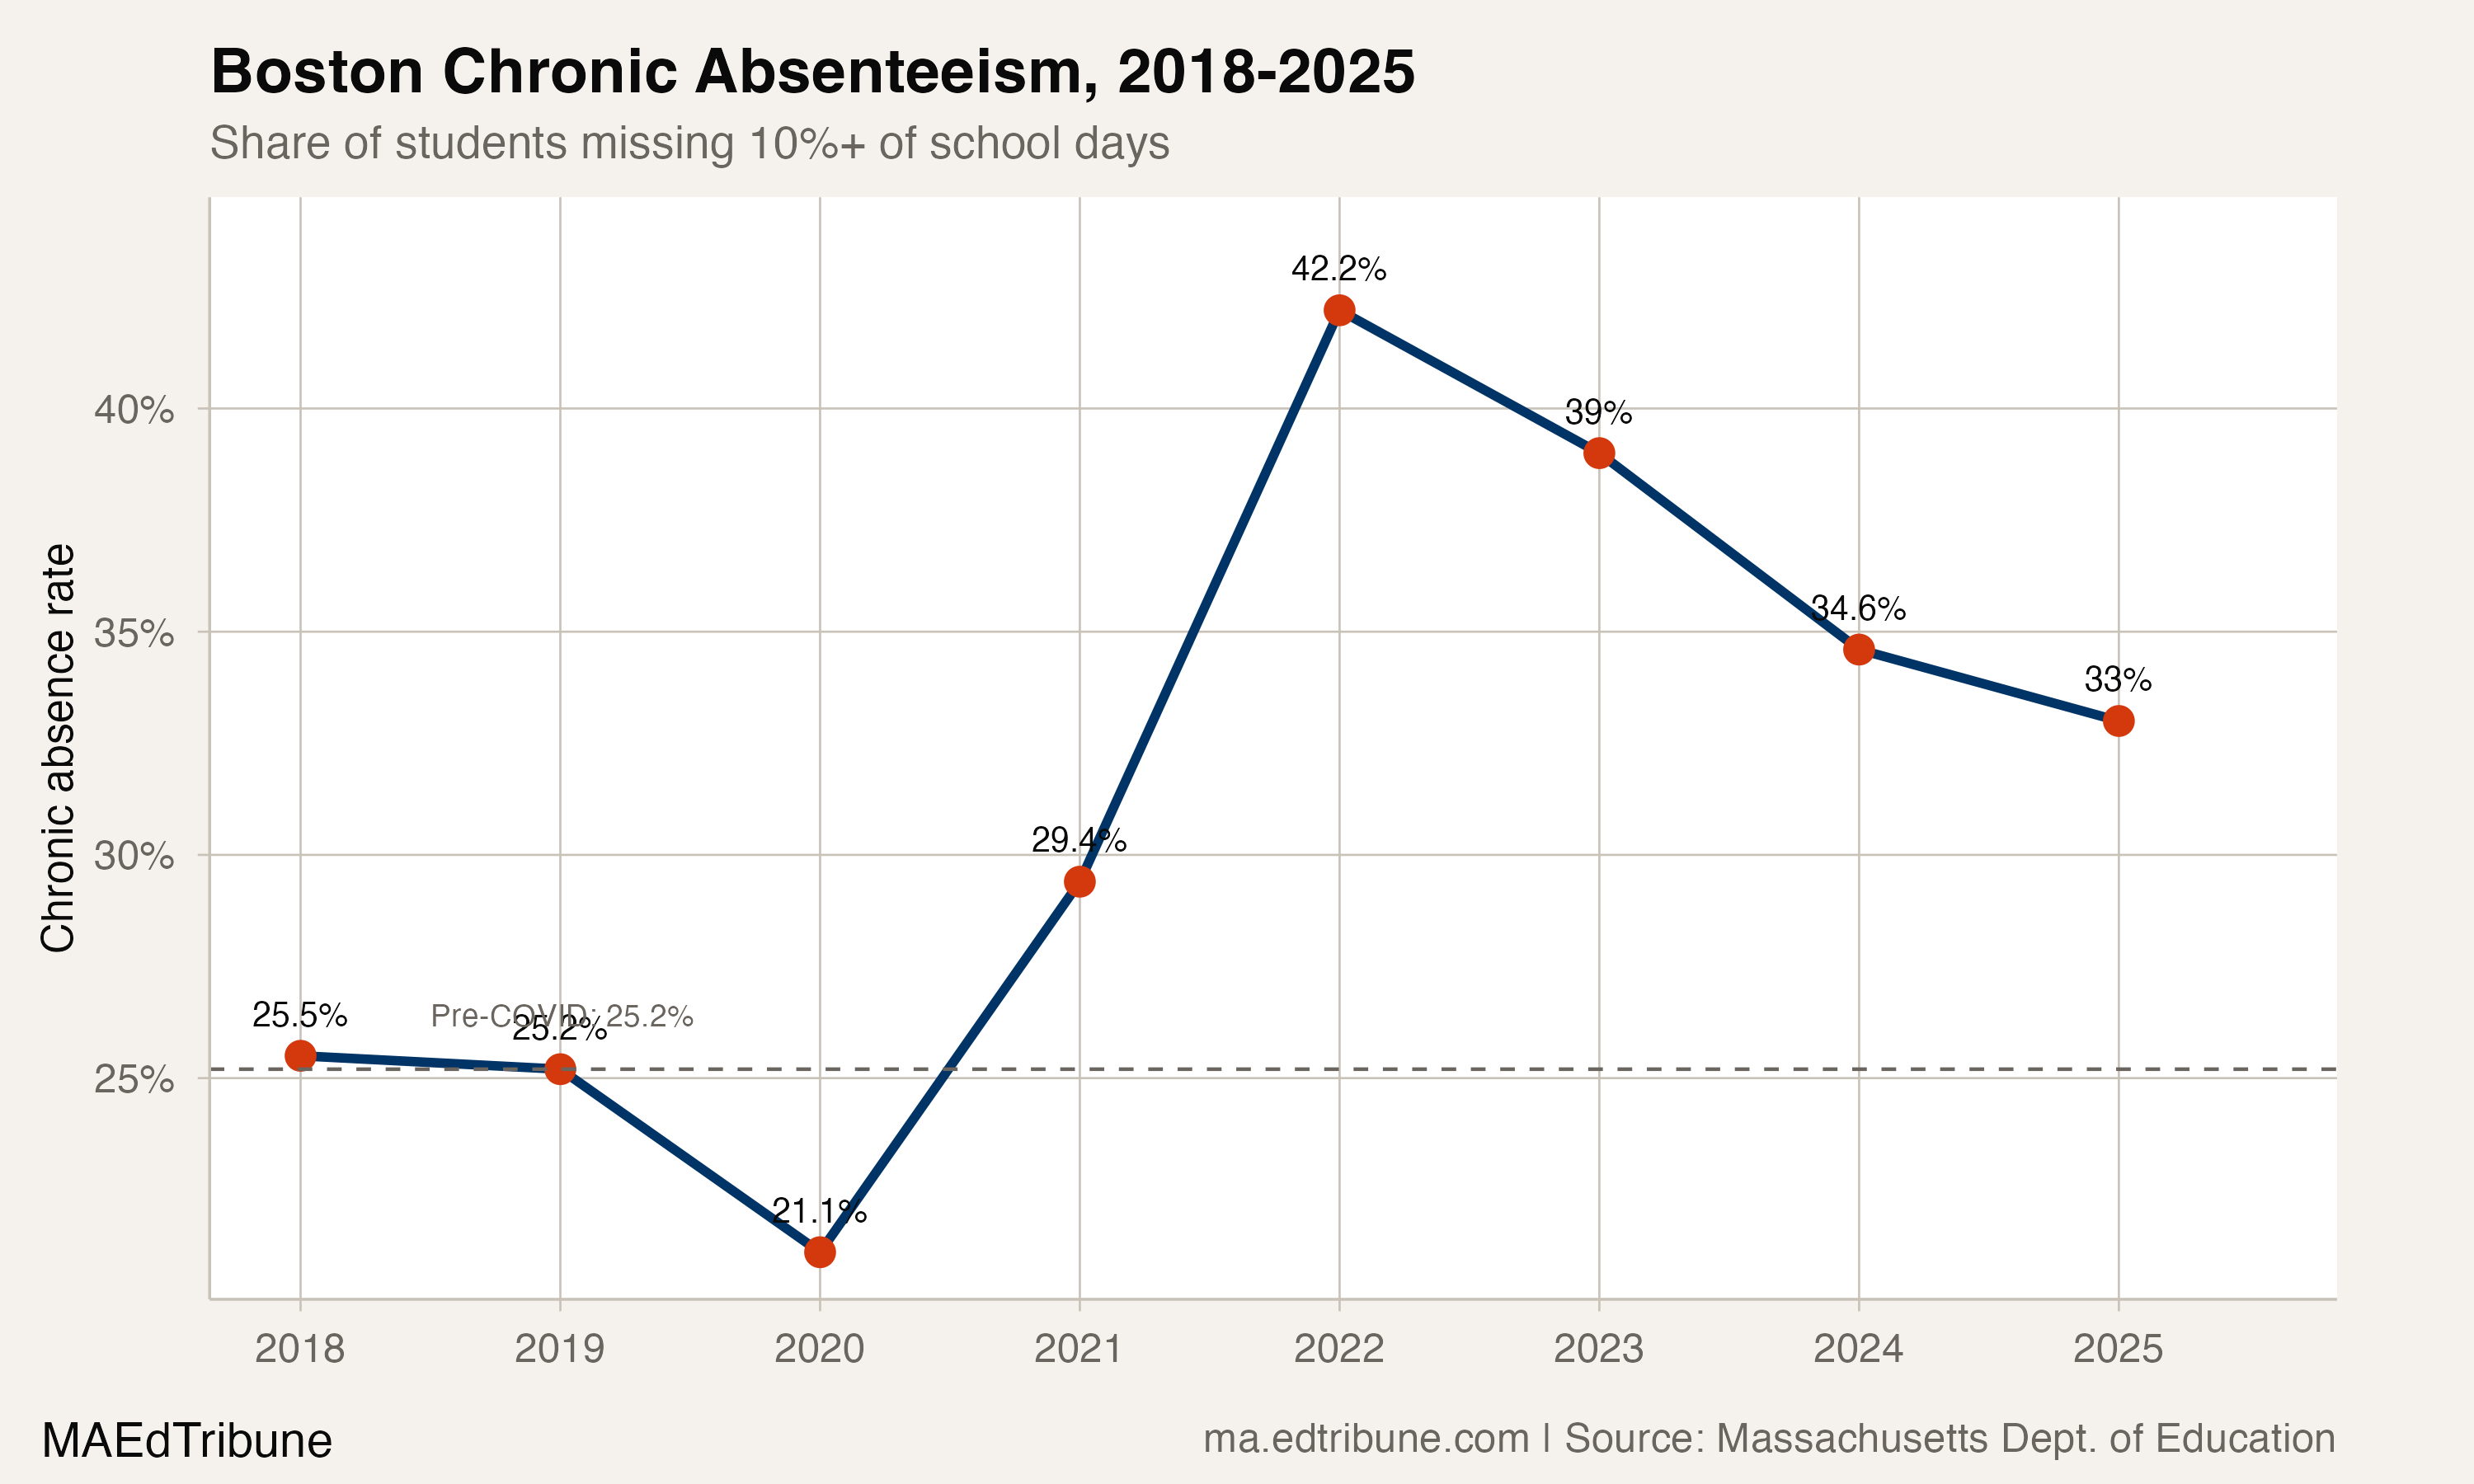
It was a warm gesture, and also a measure of how deep the attendance crisis runs. One in three Boston↗ET students was chronically absent in the 2024-25 school year. The 33.0% rate is down from a staggering 42.2% at the pandemic's peak in 2022, but it remains 7.8 percentage points above the 25.2% rate Boston posted before COVID. The district has clawed back just 54.1% of the ground it lost.
The recovery that stalled
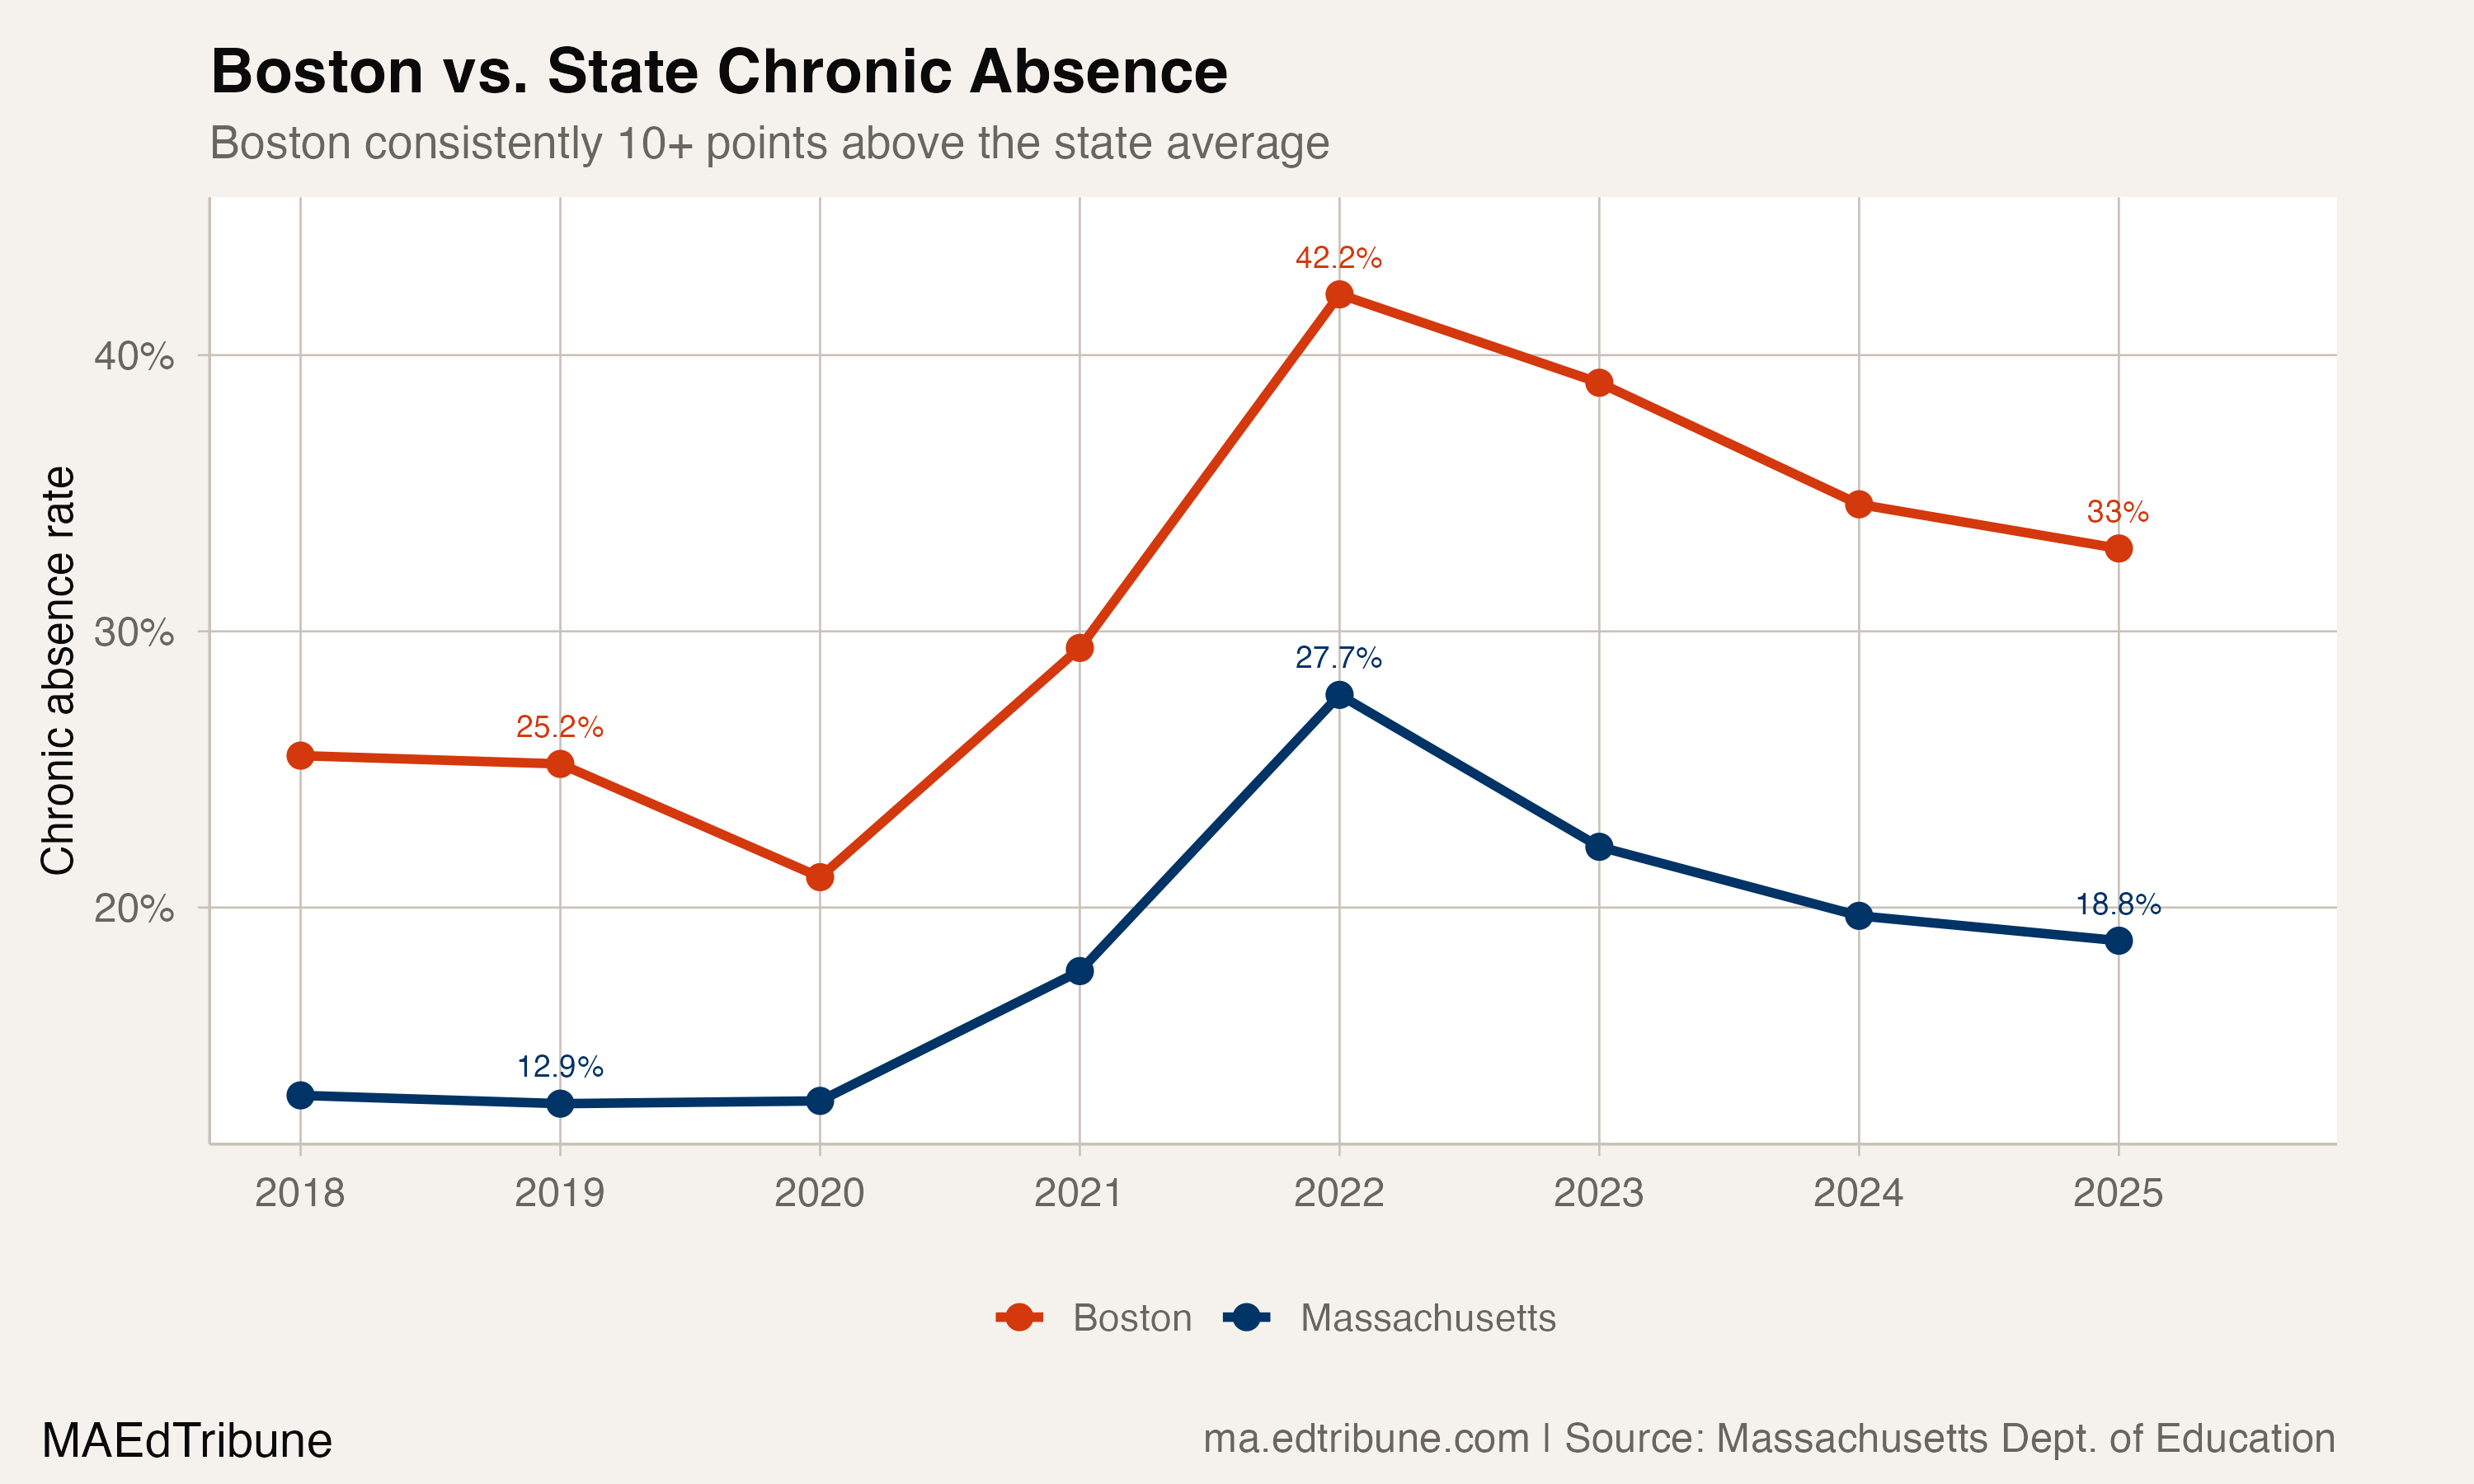
Boston's improvement followed a clear arc: a 3.2-point drop in 2023, a 4.4-point drop in 2024, then just 1.6 points in 2025. That decelerating pattern mirrors the state, where annual gains shrank from 5.5 points to under 1. But Boston started from a worse position and is recovering more slowly. The gap between Boston and Massachusetts widened from 12.3 points before COVID to 14.2 points today.
The average BPS student missed 17.2 days of school last year. Before the pandemic, the number was 13.9. That is 3.3 extra days of missed school per student, per year, compared to the pre-pandemic norm.
The district's overall attendance rate sits at 90.0%, down from 91.9% before the pandemic. BPS reported chronic absence rates in the high 40s at some high schools and in the high 20s at elementary schools.
Two school systems inside one district
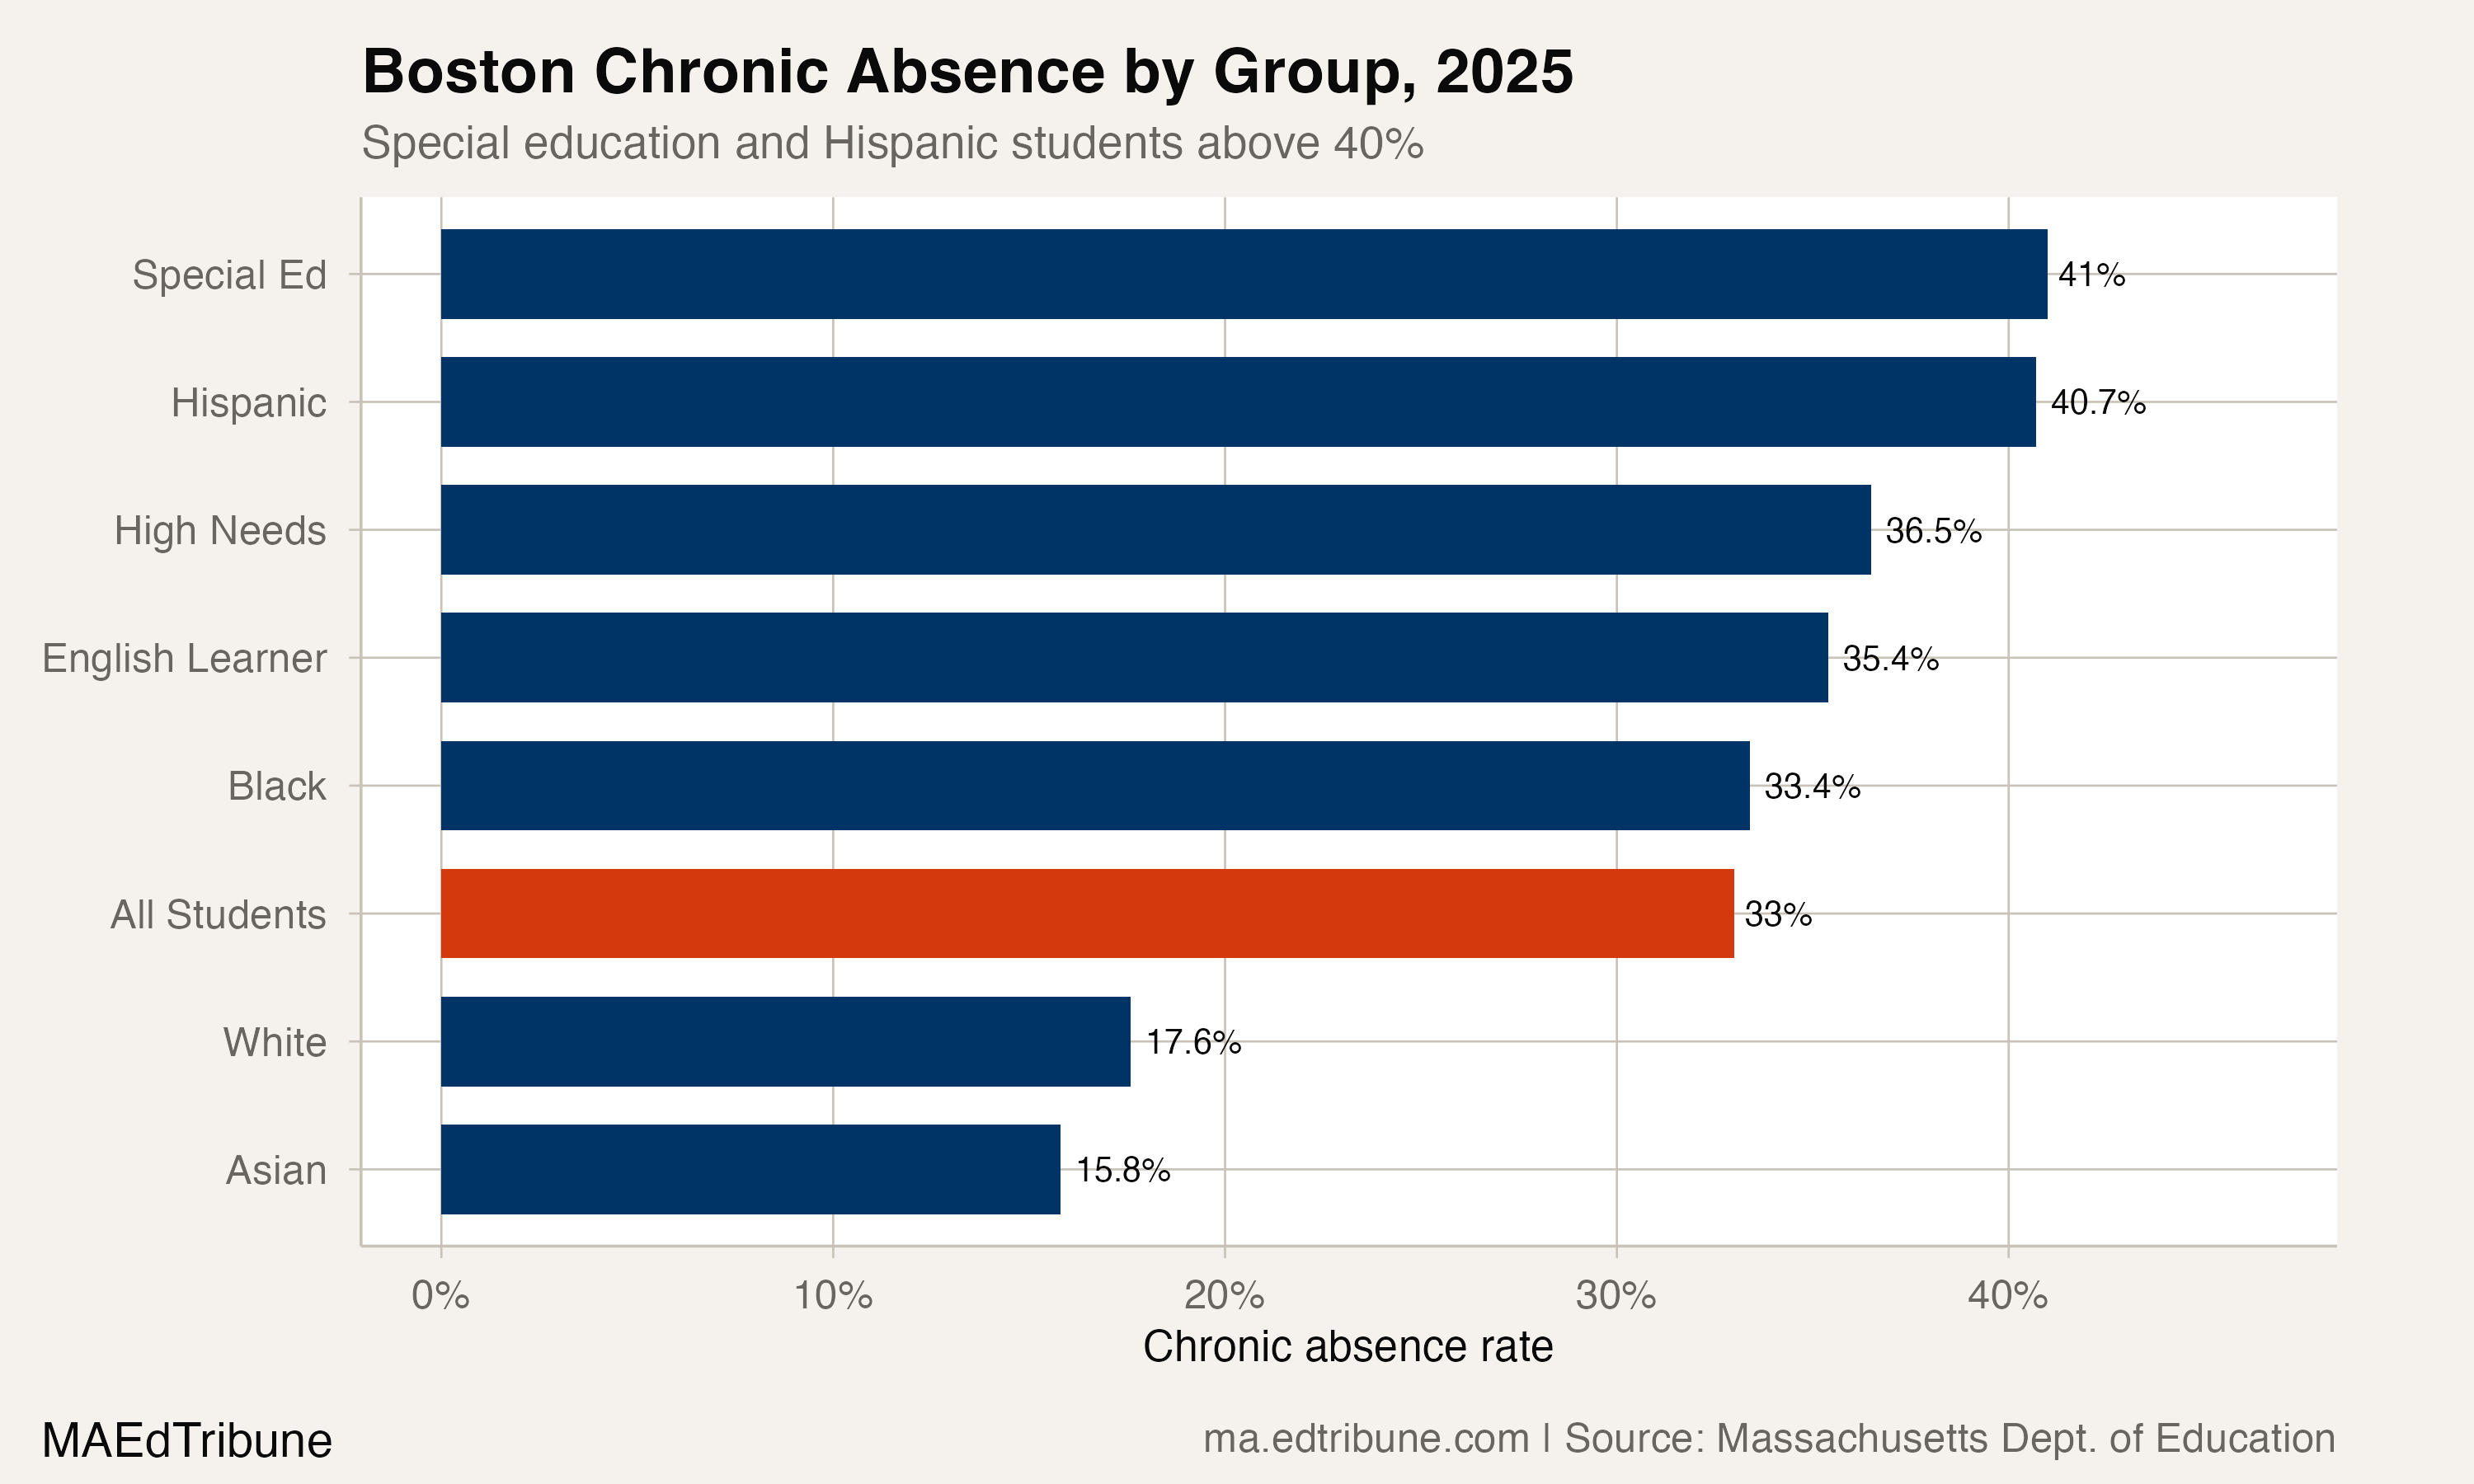
The aggregate 33.0% masks a chasm within Boston. Hispanic students face a 40.7% chronic absence rate. Students receiving special education services: 41.0%. For both groups, more than two in five students miss enough school to be classified as chronically absent.
Black students sit at 33.4%, near the district average. White students at 17.6% and Asian students at 15.8% are well below it.
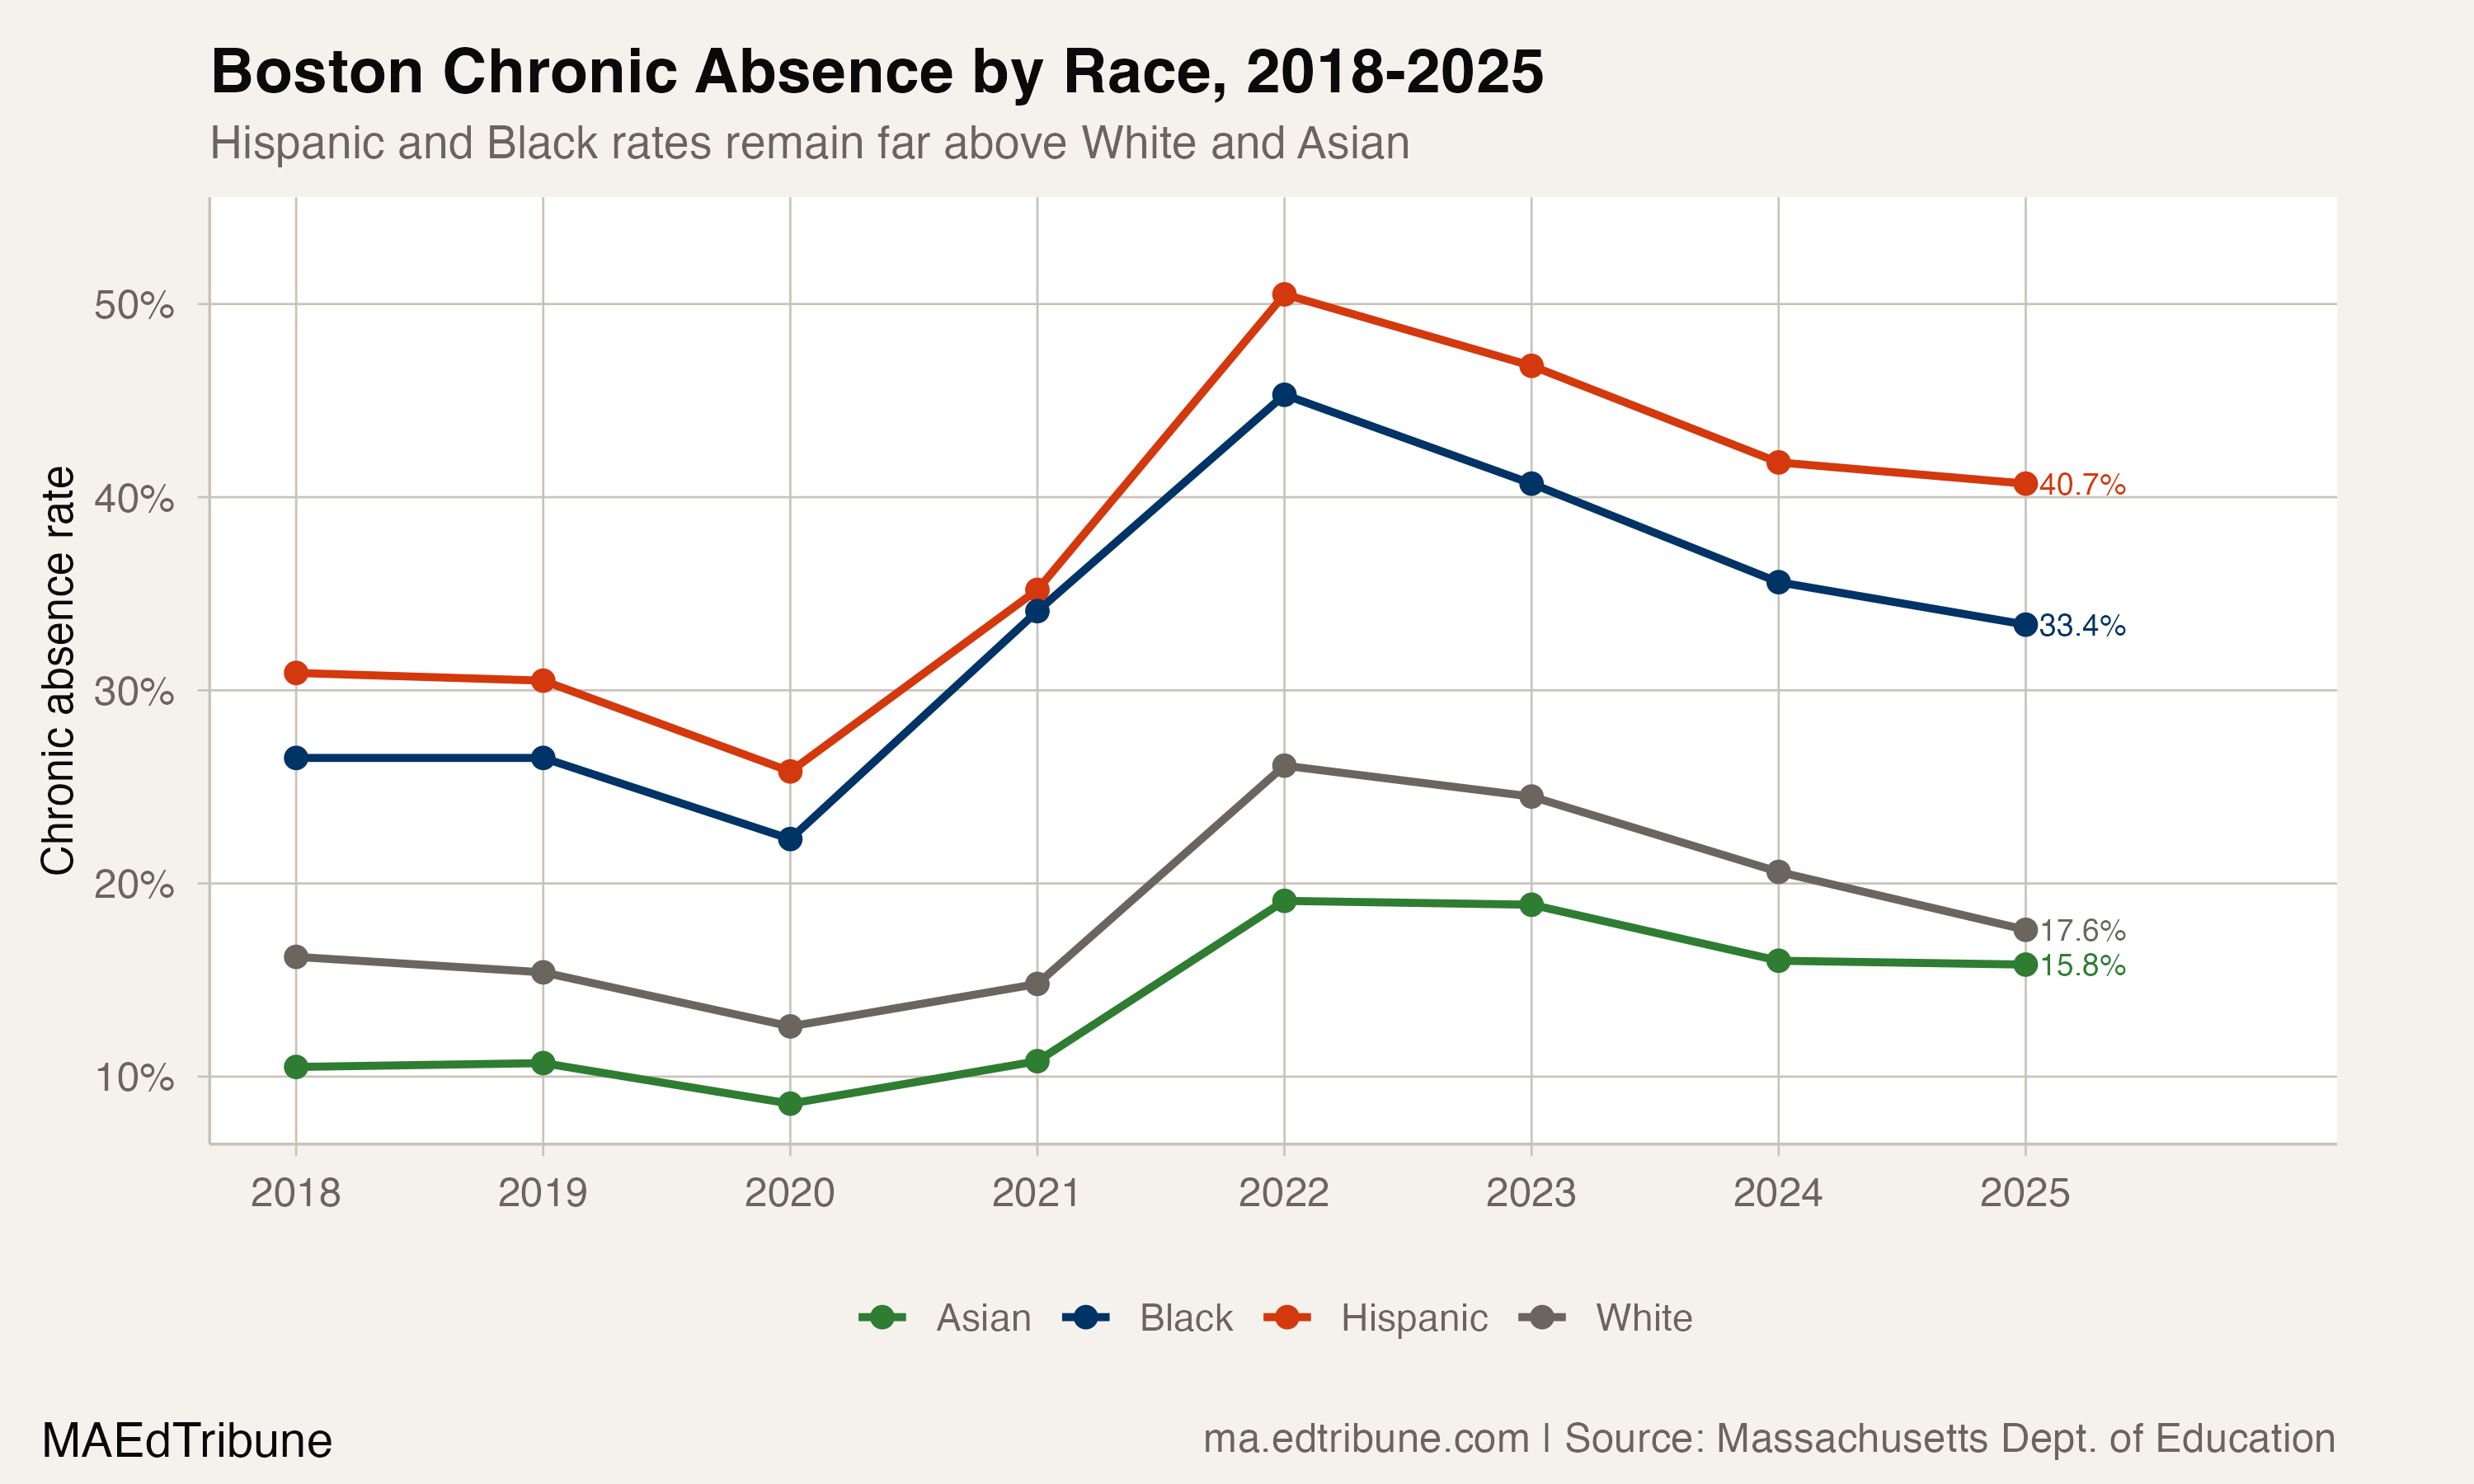
The Hispanic-white gap within Boston has widened sharply. Before COVID, the difference was 15.1 percentage points. It exploded to 24.4 points at the 2022 peak. As of 2025, it sits at 23.1 points, 8.0 points wider than before the pandemic. White students have nearly returned to their pre-COVID rate (17.6% vs. 15.4% in 2019). Hispanic students have not (40.7% vs. 30.5%).
English learners, a group that overlaps heavily with Hispanic students in Boston, face a 35.4% rate. High-needs students, a composite category that includes those receiving special education, English learner services, or from low-income families, hit 36.5%.
When Skipper's team investigated the root causes, they found a range of barriers that went far beyond defiance: rising anxiety and depression, students serving as caregivers for younger siblings, high schoolers working substantial hours, safety concerns in their neighborhoods, and immigration-related fears. The district shifted away from truancy court toward what officials describe as a support-first approach.
"Stop treating absenteeism as defiance. Start treating it as data about unmet needs." Cartwheel, on BPS's approach to attendance
The immigration dimension is new. BPS officials reported that families expressed fear regarding ICE enforcement as a barrier to attendance in the 2025-26 school year. Wu addressed it directly during the home visit campaign: "We do not ask about immigration status when it comes to registering for school."
Boston among the Gateway Cities
Boston posts the highest chronic absence rate among Massachusetts's nine largest Gateway Cities, edging Springfield (32.8%) and Lynn (30.8%). Lawrence, the only Gateway City that has fully recovered to pre-COVID levels, sits at 23.3%. Lowell, at 21.4%, is the lowest.
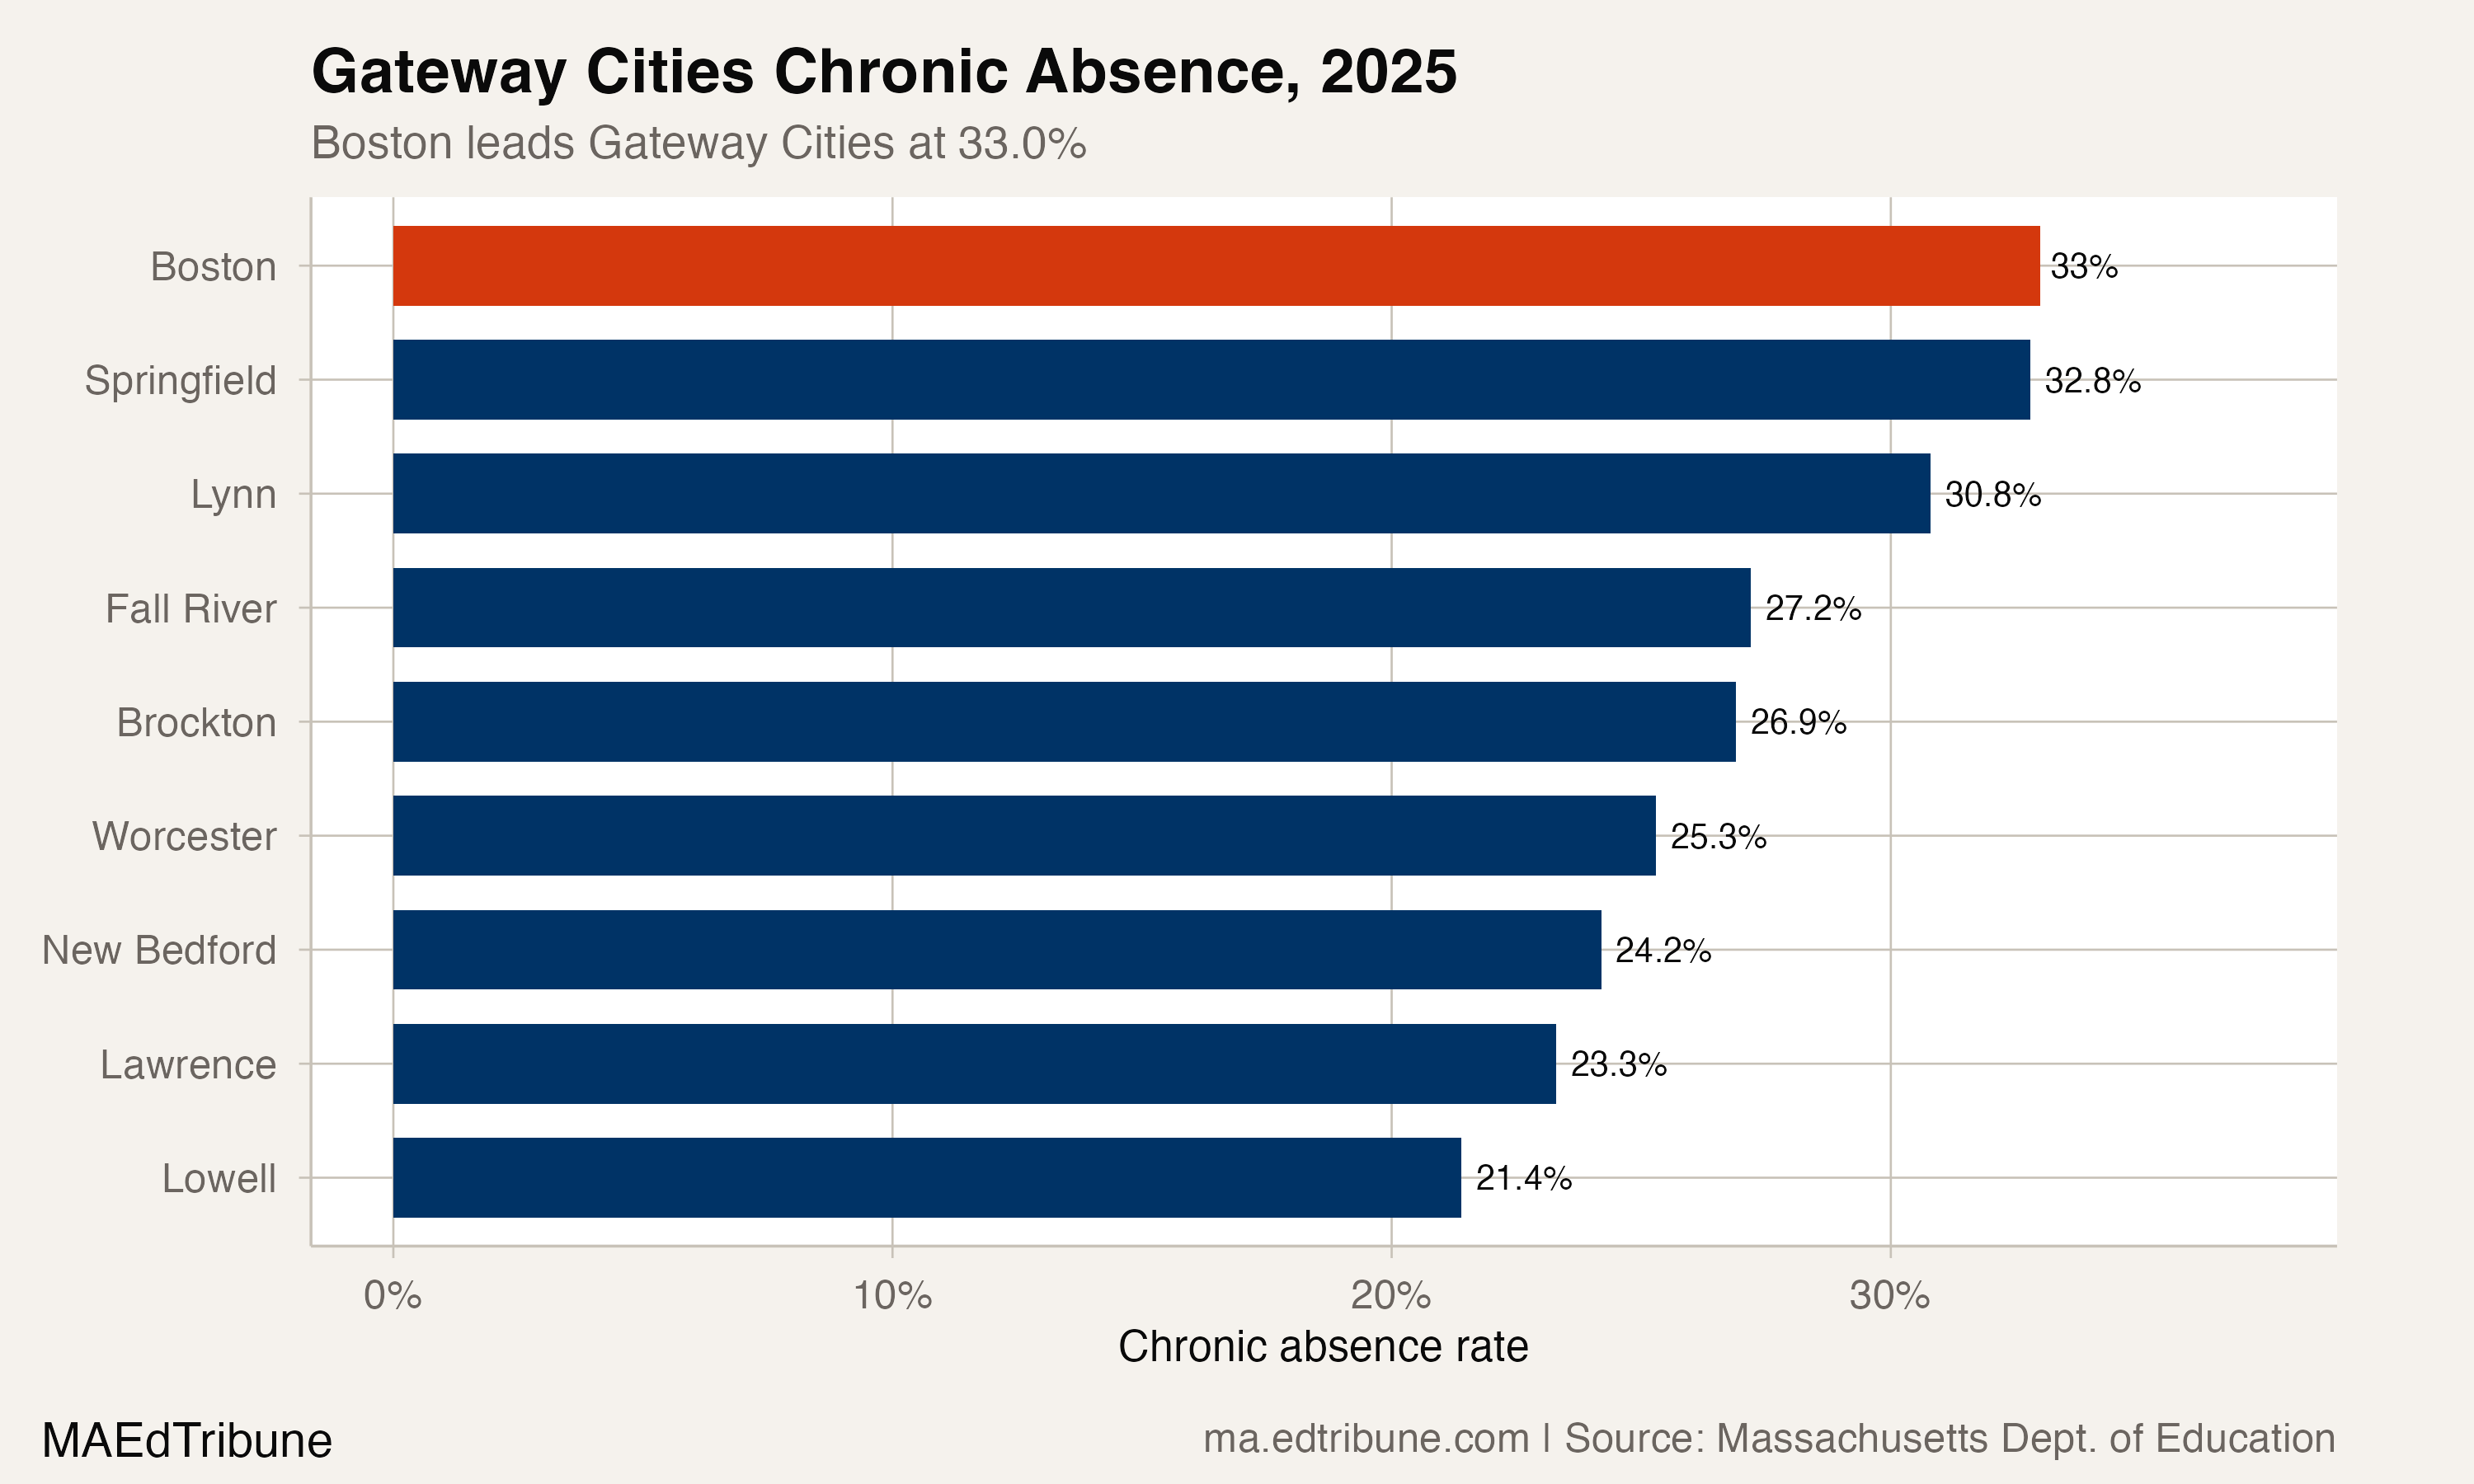
The 11.6-point spread between Boston and Lowell within the same category of urban districts points to something beyond demographics. Lawrence's turnaround, achieved under state receivership since 2012, suggests that structural interventions can bend the curve. Boston, the state's largest district by far, faces a different scale of challenge.
The graduation paradox
Here is what makes Boston's attendance data so difficult to read in isolation. The district posted a record 81.3% four-year graduation rate for the Class of 2025, up from 59.1% in 2006. The dropout rate fell to 3.6%, a record low. English learners saw a 5-point graduation rate increase. Students with disabilities gained more than 5 points.
How does a district where a third of students are chronically absent also produce its best-ever graduation rate?
Part of the answer is structural. The Class of 2025 was the first in Massachusetts not required to pass MCAS to graduate. Credit-recovery programs boosted BPS's four-year rate by 4.8 percentage points on their own. A 2021-22 grading policy change eliminated "No Credit" grades in favor of "incomplete" marks. Meanwhile, only about 40% of BPS tenth-graders meet expectations on MCAS reading and math, a figure that has fallen since 2019.
This is not an argument that Boston's attendance gains are illusory. Four consecutive years of declining chronic absenteeism represent real progress, built on real investments: re-engagement teams, career pathways, expanded counseling, Panorama Student Success tracking software, and school-by-school attendance teams. But the gap between the graduation headline and the attendance reality suggests the district is credentialing students who are missing substantial instructional time.
What to watch
The 1.6-point improvement in 2025, the smallest since recovery began, raises a practical question. The low-hanging fruit has been picked. The students who were easiest to re-engage are back. The remaining 33.0%, disproportionately Hispanic, receiving special education services, and from low-income families, face barriers that door knocks and gift cards alone will not solve.
The Boston Herald reported that BPS teachers missed an average of 10.7 days during the 2024-25 school year. DESE Commissioner Pedro Martinez noted "there's nothing more important than students having access to not only teachers, but all staff in their schools." When the adults in the building are absent at rates approaching chronic thresholds, the message to students is harder to deliver.
Boston will need to close 7.8 percentage points to return to where it was before COVID. At the current pace of improvement, that would take nearly five years. The Hispanic-white gap, 8 points wider than 2019, shows no sign of narrowing. And the special education rate, at 41.0%, means that the students who most depend on consistent, structured instruction are the ones least likely to receive it.
Detailed code that reproduces the analysis and figures in this article is available exclusively to EdTribune subscribers.
Discussion
Sign in to join the discussion.
Loading comments...