In this series: Massachusetts Chronic Absenteeism.
Correction (July 21, 2026): An earlier version projected the current 3.1-day average-absence gap across a 13-year school career and described subgroup overlap and possible causes that the Massachusetts attendance file cannot measure. Those claims have been removed. The numeric comparisons below were rebuilt from current state DOE data.
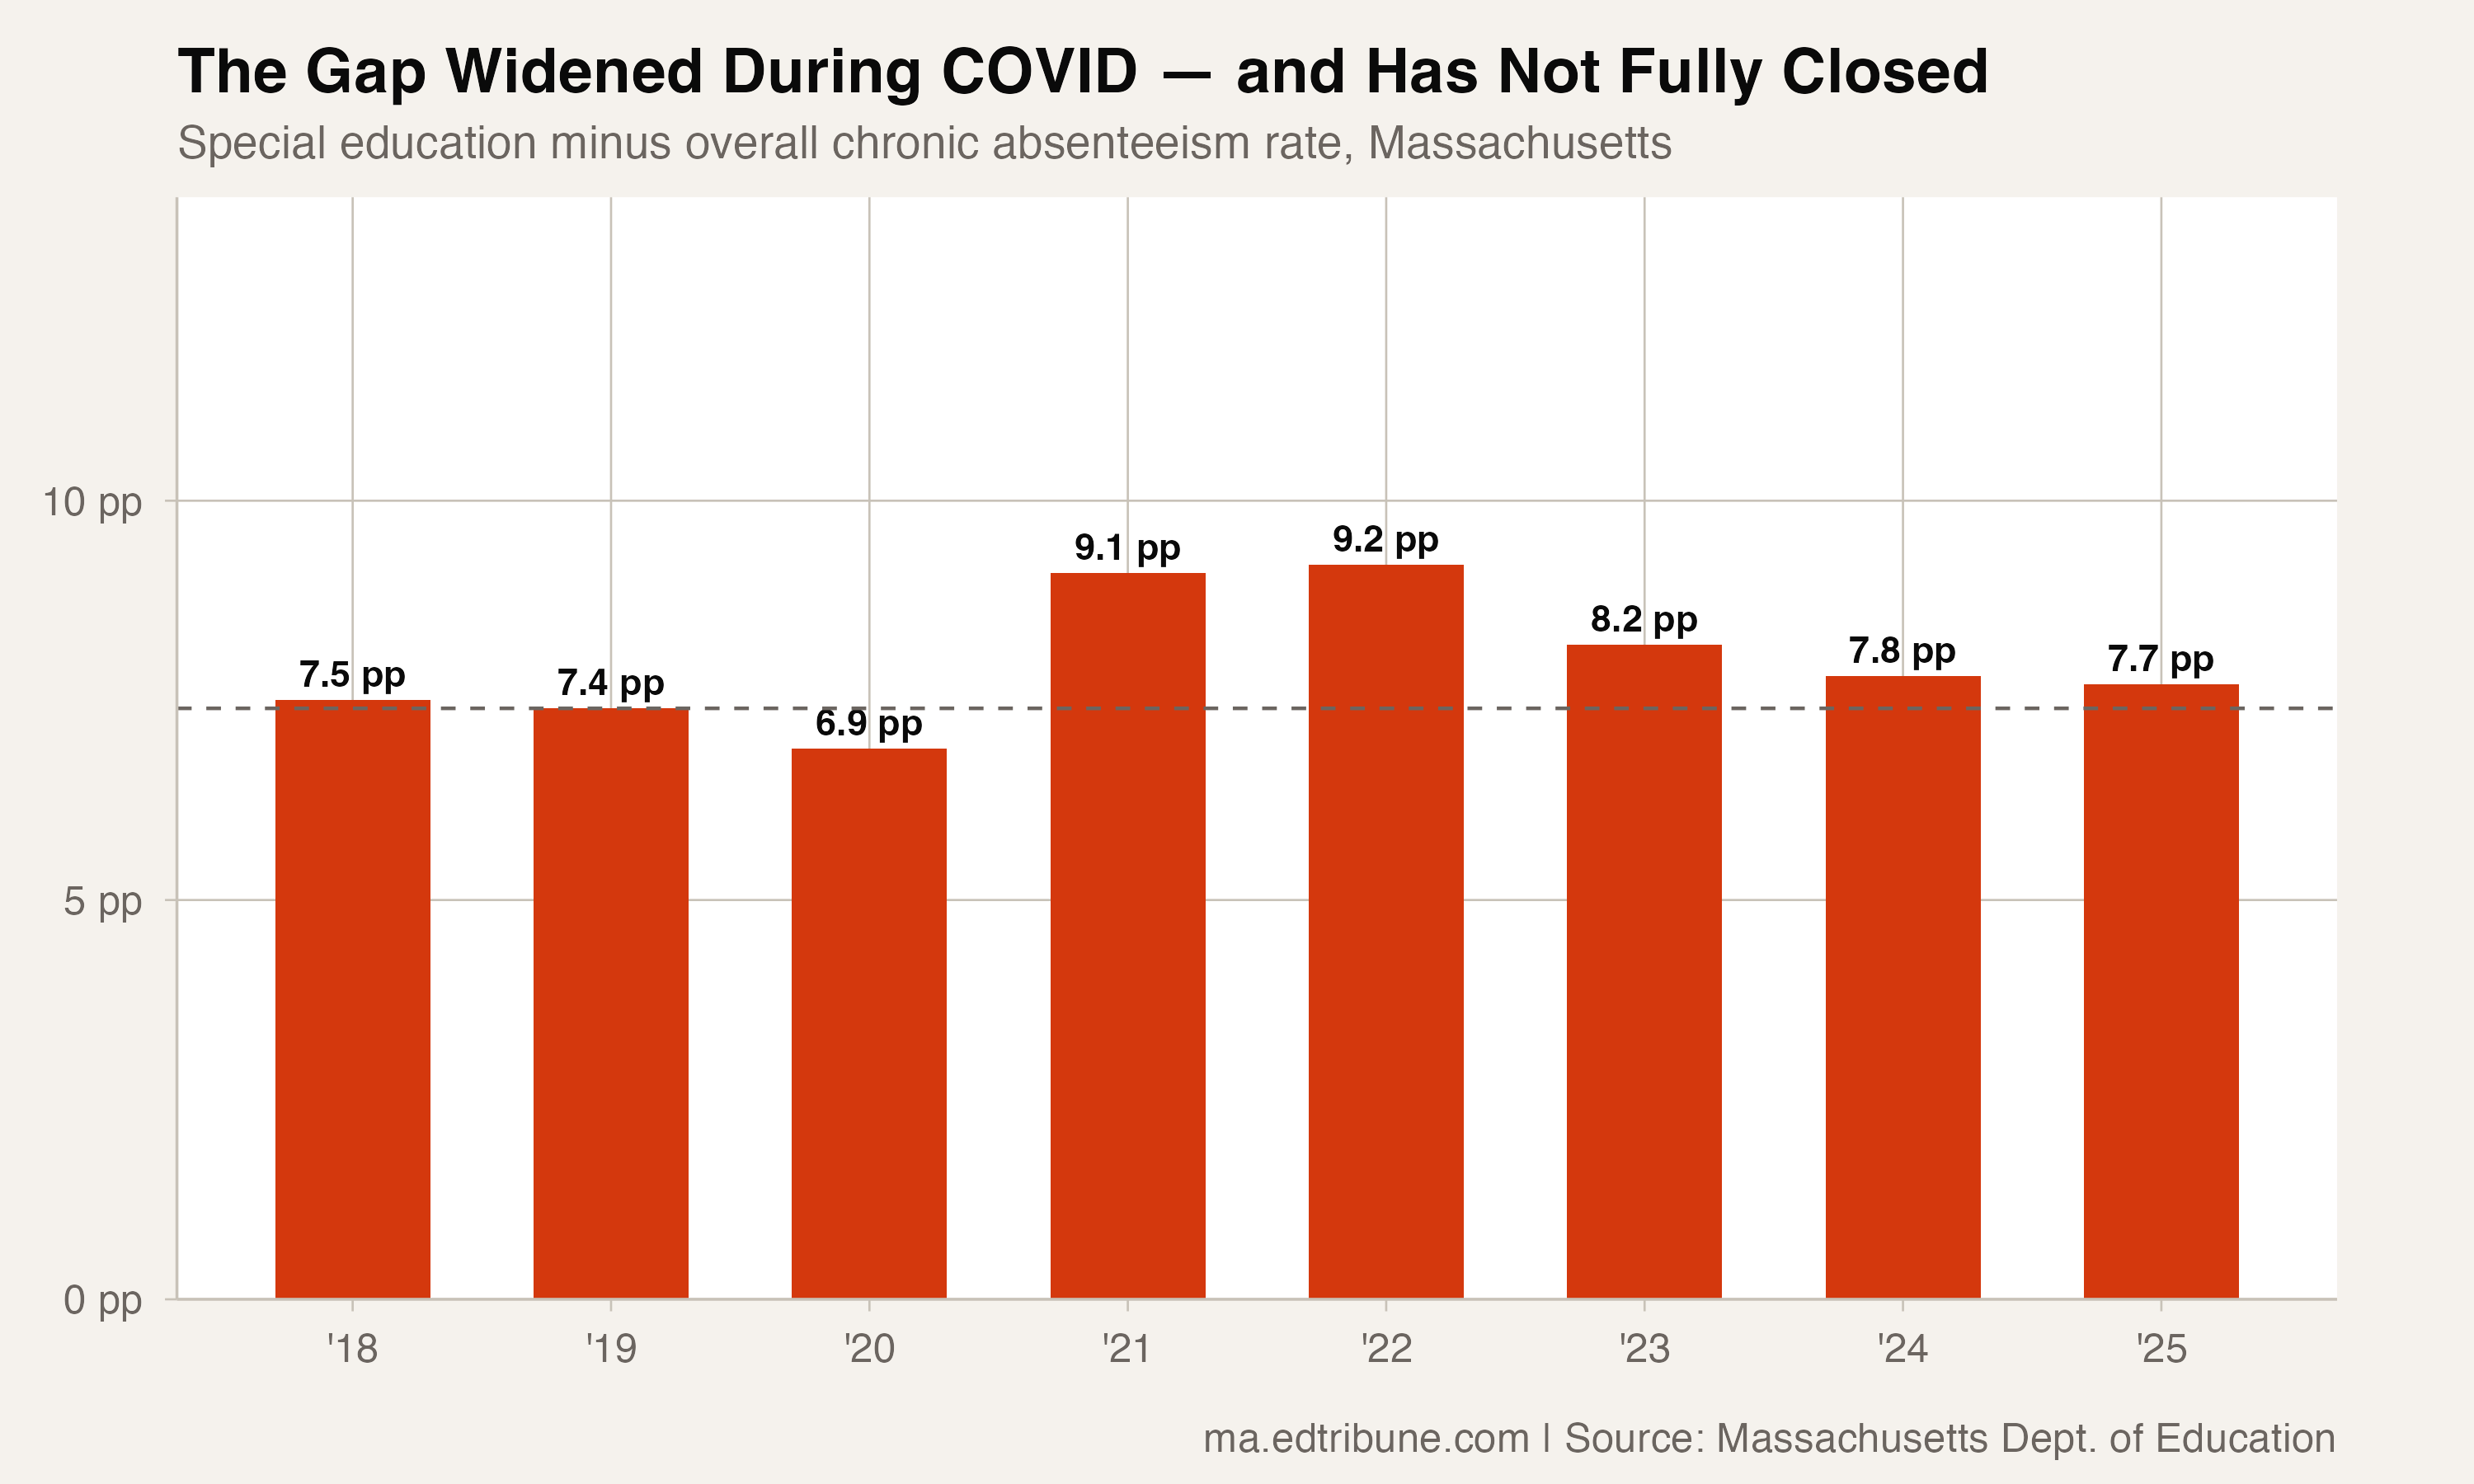
In 2024-25, Massachusetts special education students averaged 15.0 absences, compared with 11.9 for all students. Their chronic-absence rate was 26.5%, versus 18.8% statewide. That is a 7.7-percentage-point gap.
The gap predates the pandemic in the package series. It was 7.5 points in 2017-18 and 7.4 in 2018-19, reached 9.2 points in 2021-22 and narrowed to 7.7 by 2024-25. The latest rate still means more than one in four special education students was chronically absent.
The gap that will not close
Special education chronic absenteeism was 20.7% in 2017-18 and 20.3% in 2018-19. By 2021-22, the overall rate had risen from 12.9% to 27.7%, while the special education rate had risen from 20.3% to 36.9%. Those increases were 14.8 and 16.6 points, respectively; the special education increase was 81.8% relative to its 2018-19 rate.
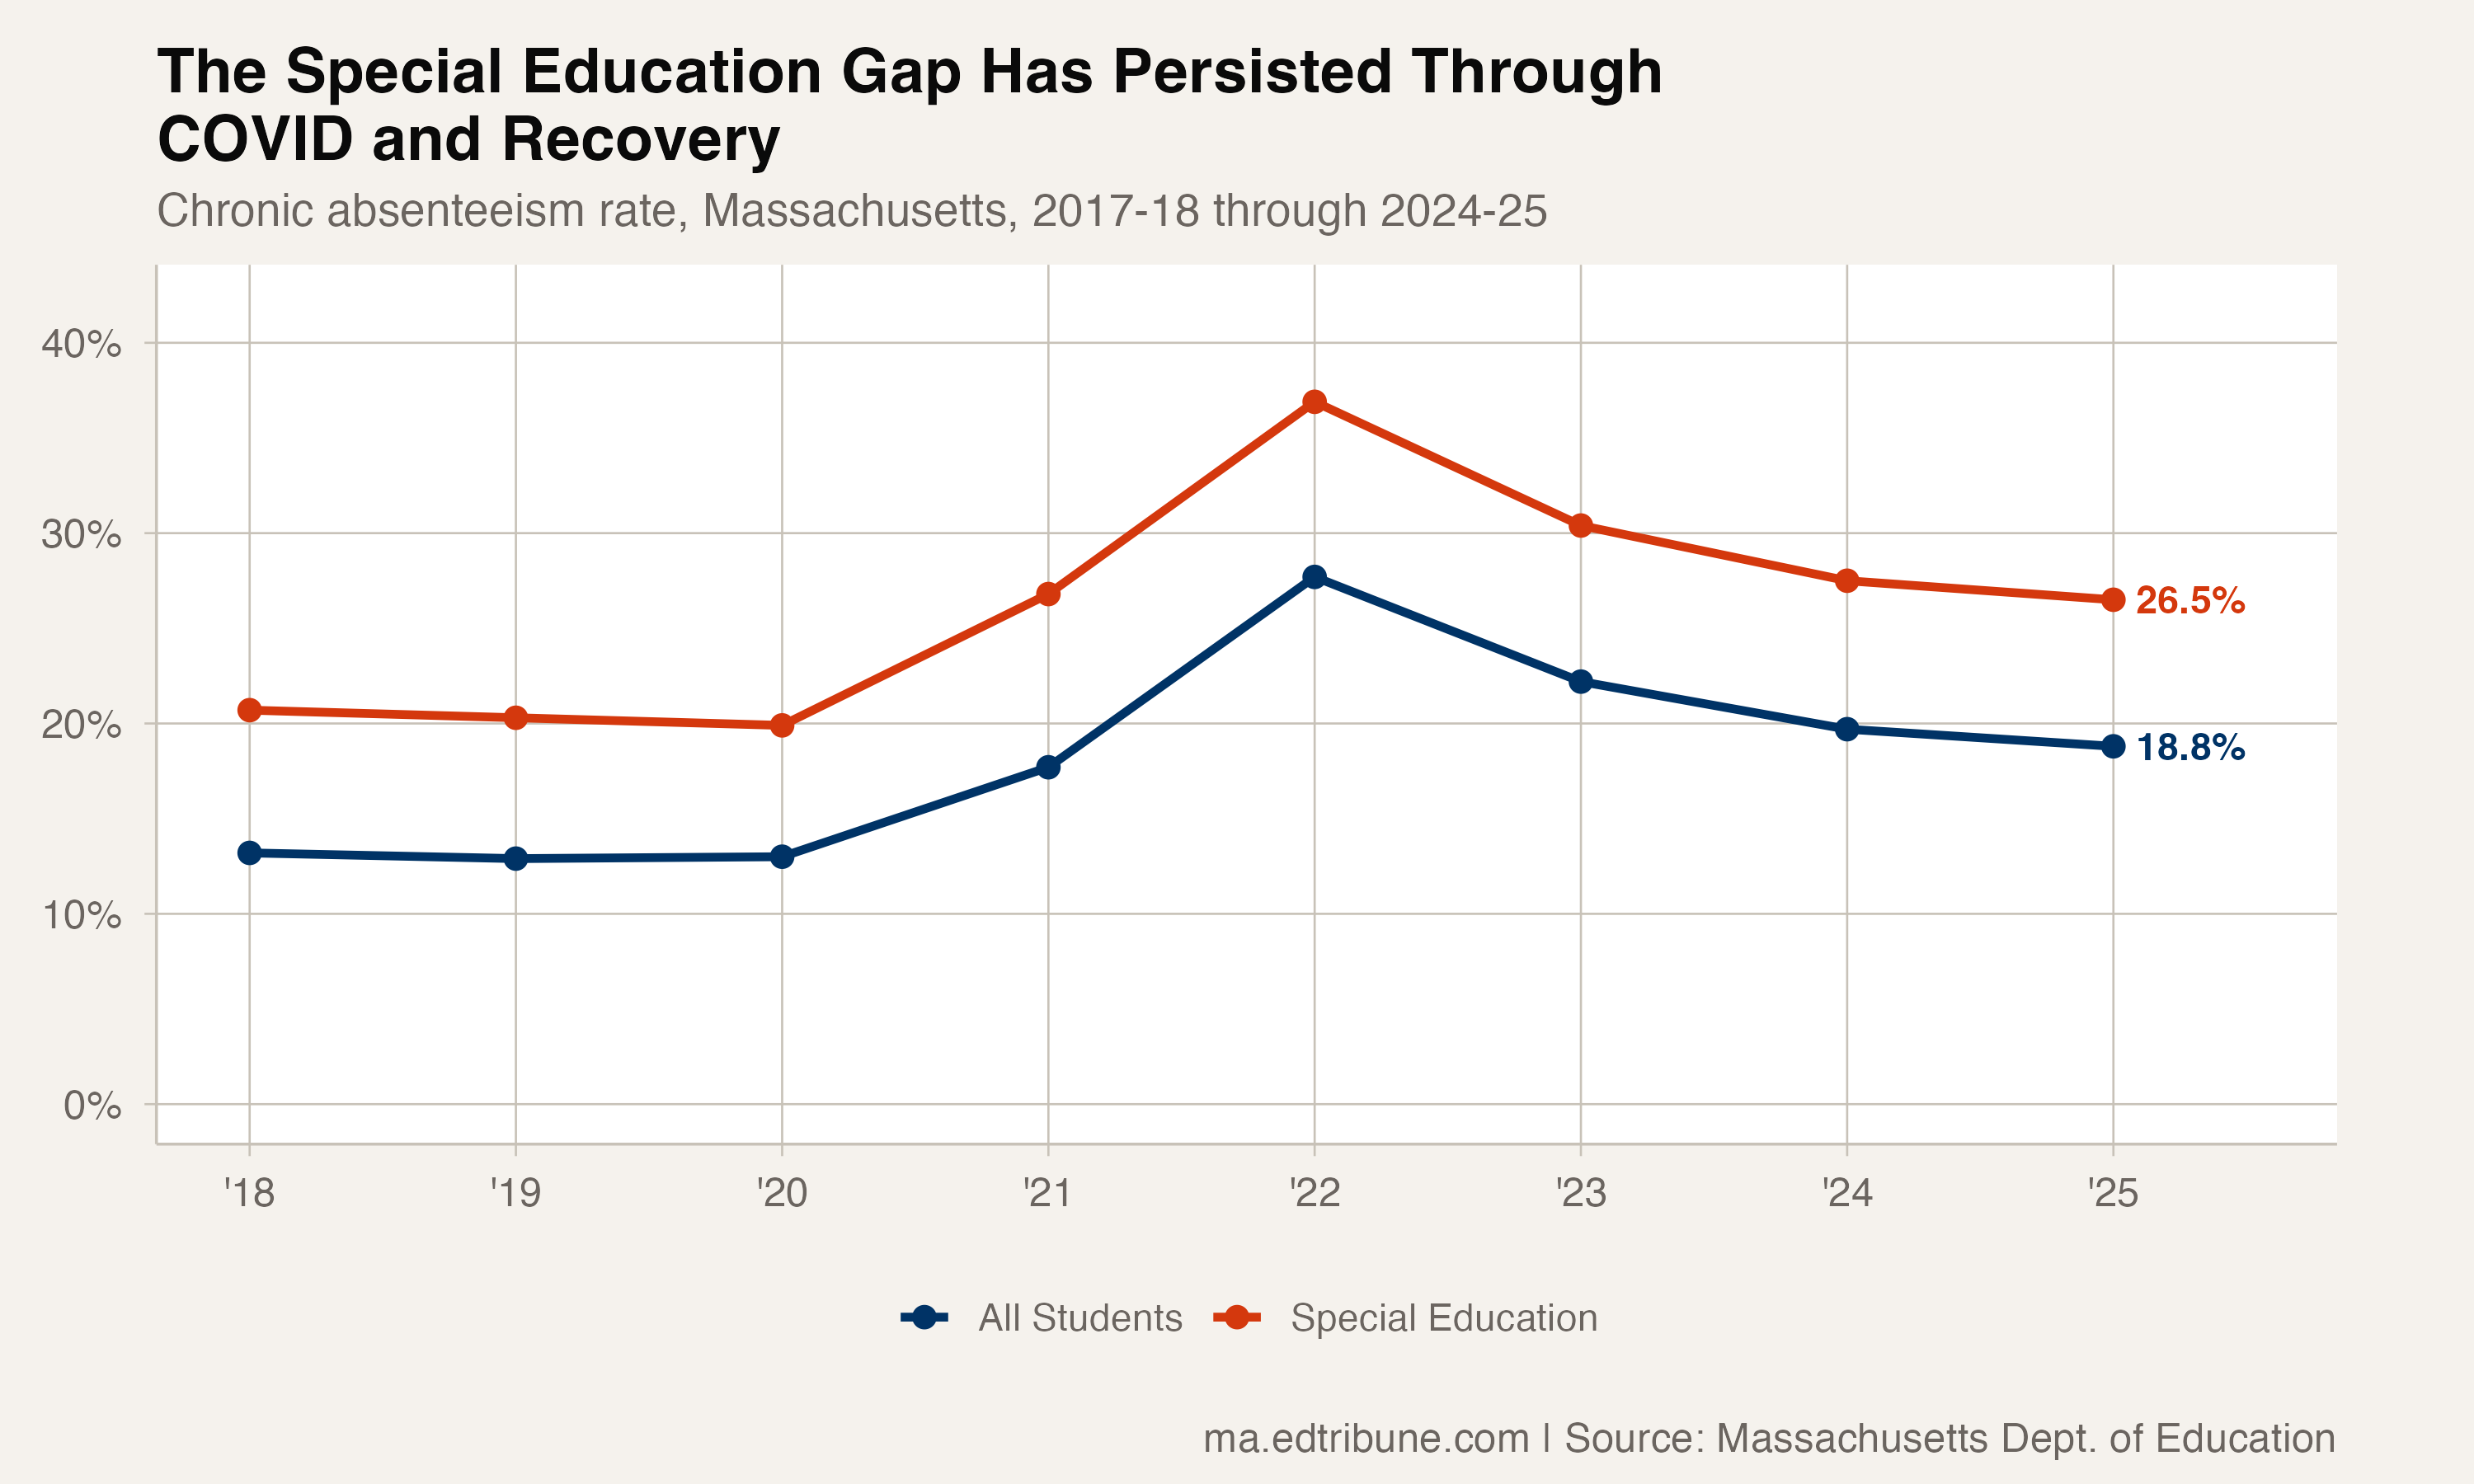
Measured as the share of the 2018-19-to-2021-22 increase reversed by 2024-25, the special education rate recovered 62.7%, while the all-student rate recovered 60.1%. Even after those declines, the special education rate remained 6.2 points above its 2018-19 level, and the overall rate remained 5.9 points above.
The annual special education declines also became smaller: 6.5 points in 2022-23, 2.9 points in 2023-24 and 1.0 point in 2024-25.
In 92% of districts, the gap exists
Among 394 districts with both special education and all-student rates in 2024-25, 361 — 91.6% — had a higher special education rate. Thirty-two had a lower rate and one had an equal rate. The mean gap was 5.9 points and the median was 6.0.
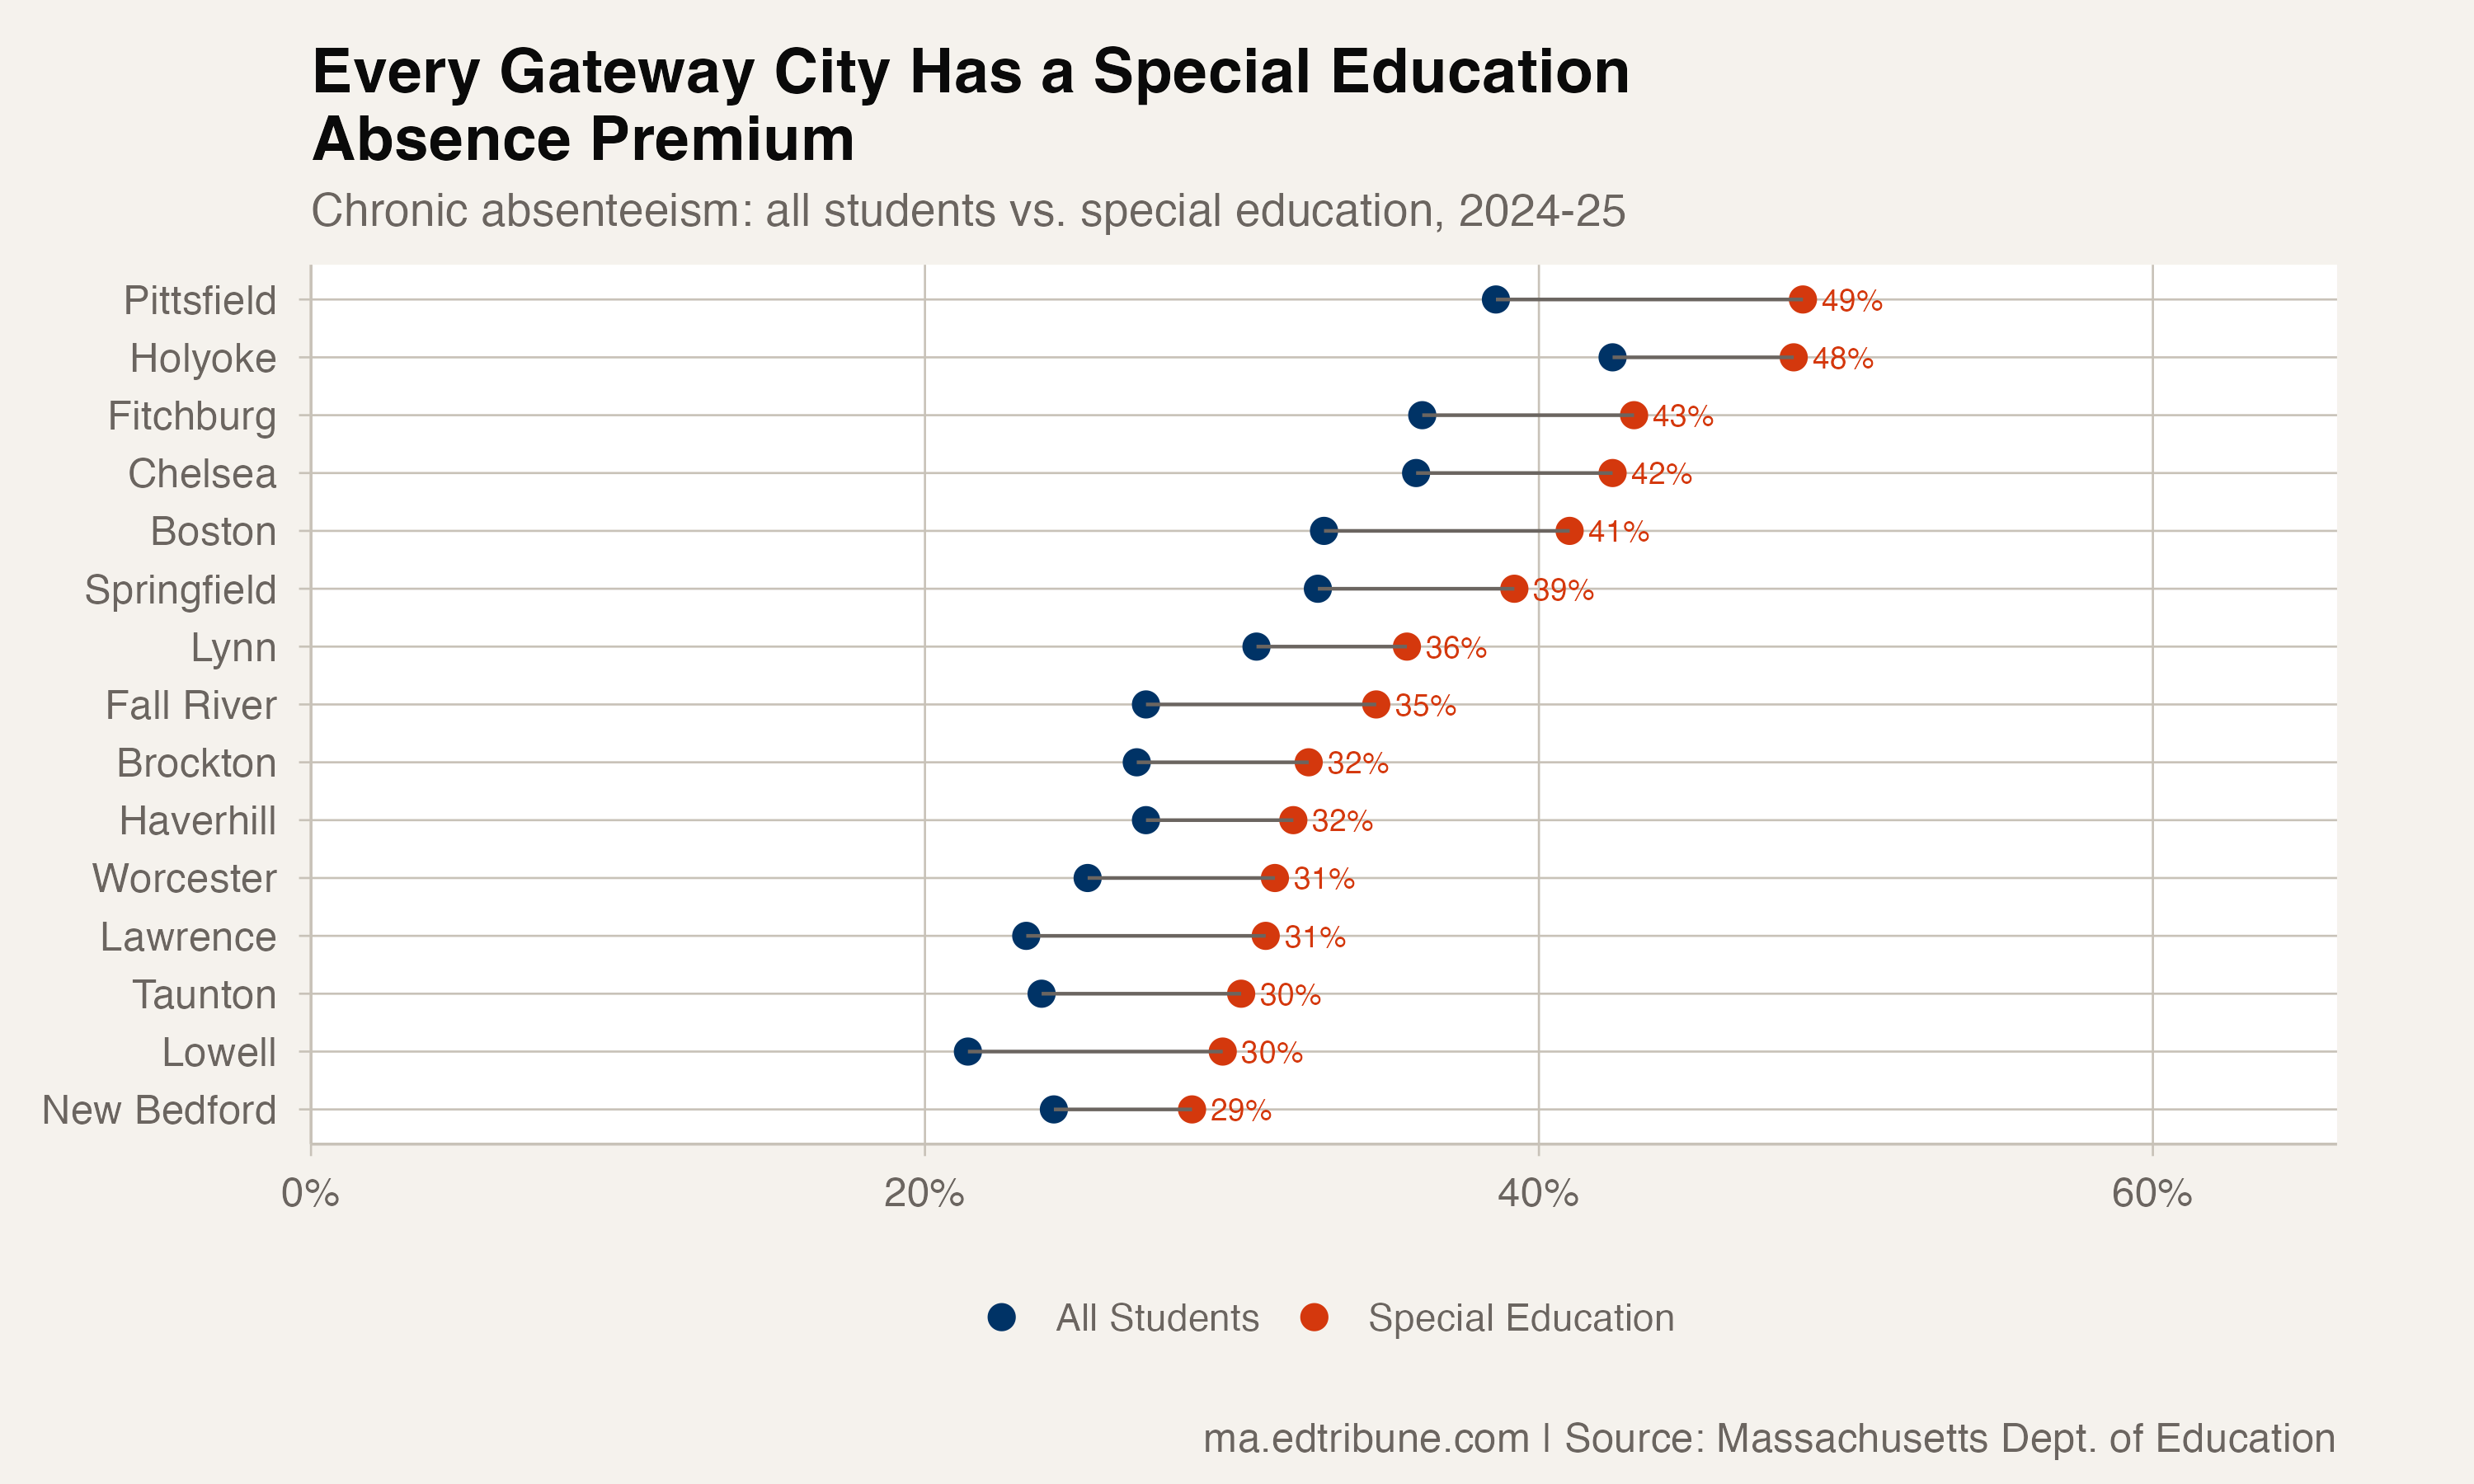
All 15 Gateway Cities in the analysis had special education rates above the 18.8% statewide all-student rate. Pittsfield↗ET had the highest Gateway City special education rate at 48.6%. Holyoke↗ET was at 48.3%, Boston↗ET at 41.0% and Springfield↗ET at 39.2%.
Gateway City gaps ranged from 4.5 points in New Bedford to 10.0 in Pittsfield. In Lawrence↗ET, the overall rate was 23.3% and the special education rate was 31.1%, a 7.8-point gap.
The outliers on both ends
Among the 32 districts with lower special education rates, Orleans reported 2.8% for special education and 12.5% overall, Savoy reported 0.0% and 12.8%, and Florida reported 0.0% and 4.7%. The package does not provide the subgroup denominators needed to judge how small counts affected those rates.
At the other end, 81 districts had special education rates above 30%, and 26 exceeded 40%. Phoenix Academy Public Charter High School in Springfield reported 100.0%, Boston Day and Evening Academy Charter reported 94.2%, and Map Academy Charter School reported 93.7%.
What the subgroup ranking reveals
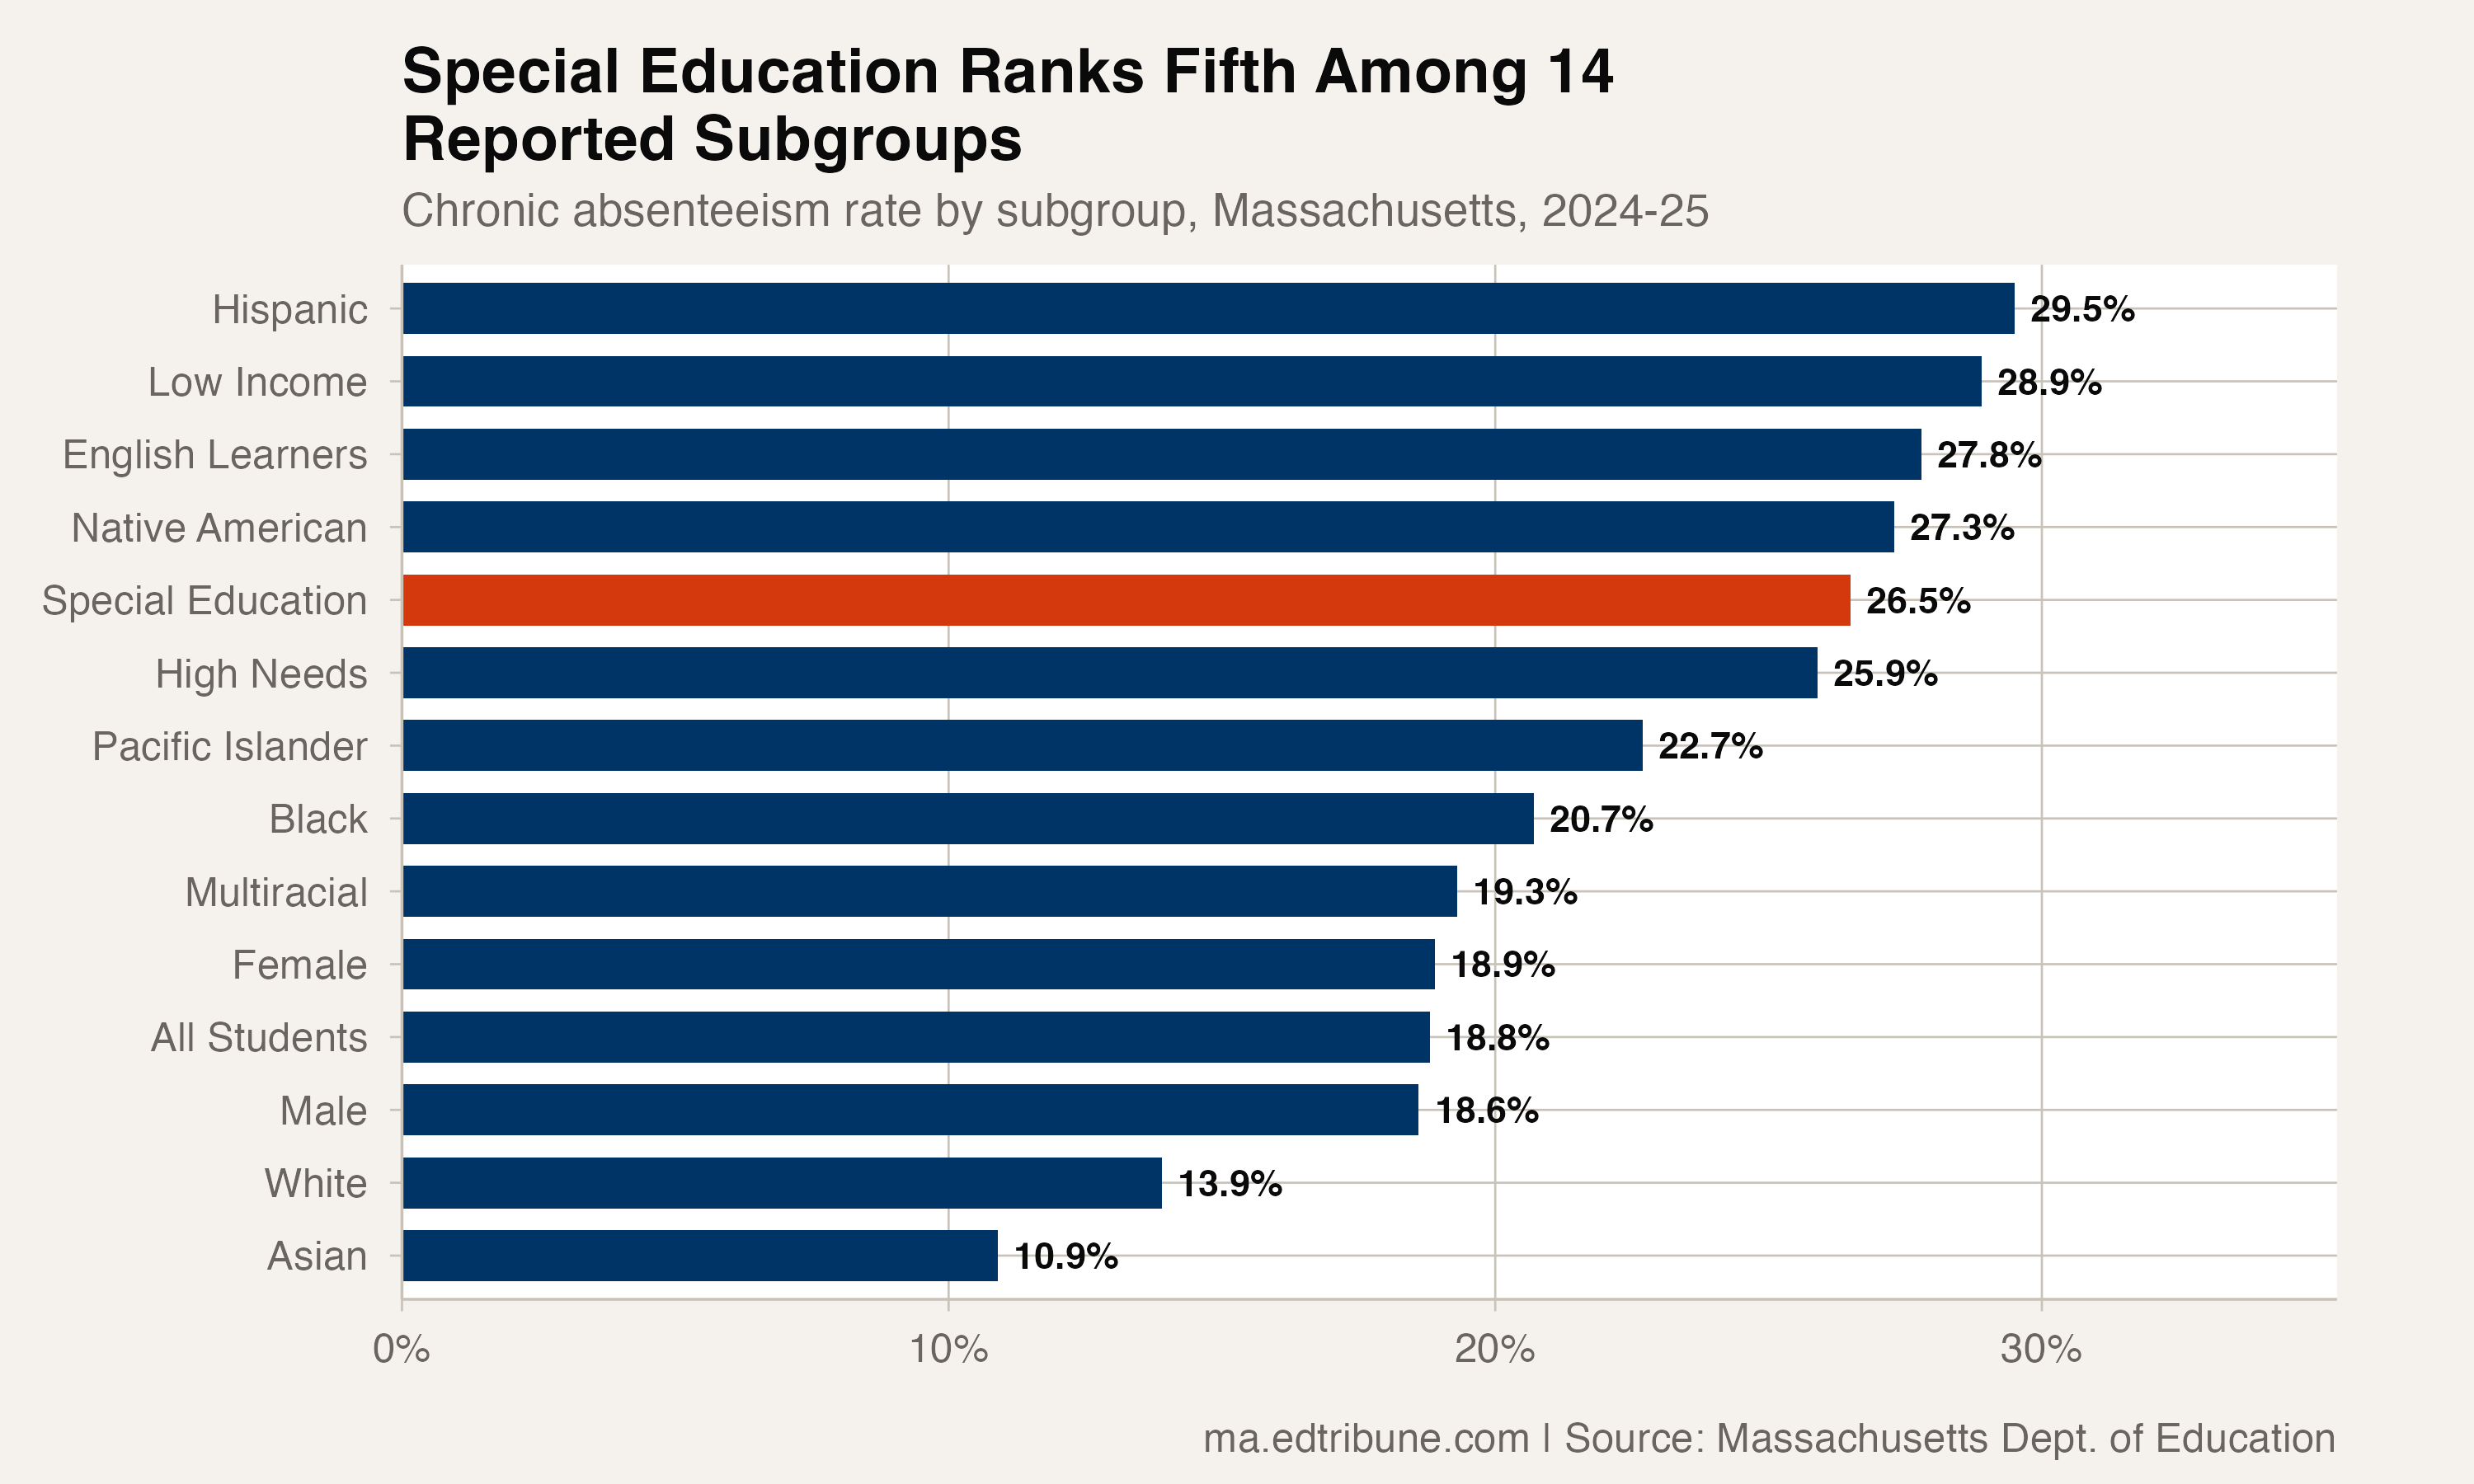
At the state level, special education had the fifth-highest chronic-absence rate among 14 reported subgroup rows in 2024-25. The four higher rates were Hispanic students at 29.5%, low-income students at 28.9%, English learners at 27.8% and Native American students at 27.3%.
The high-needs category had a chronic absence rate of 25.9%, slightly below the special education rate alone.
The average-absence gap
The package's average-absence measure was 15.0 for special education students and 11.9 for all students in 2024-25, a 3.1-day difference. In 2018-19, the corresponding averages were 12.3 and 9.6, a 2.7-day difference. The current file supports those annual averages; it does not support projecting one year's gap across a student's full school career.
The special education chronic-absence rate has fallen for three consecutive years, but its gap with the statewide rate remains close to the pre-pandemic level.
Detailed code that reproduces the analysis and figures in this article is available exclusively to EdTribune subscribers.
Discussion
Sign in to join the discussion.
Loading comments...