In this series: Massachusetts 2025-26 Enrollment.
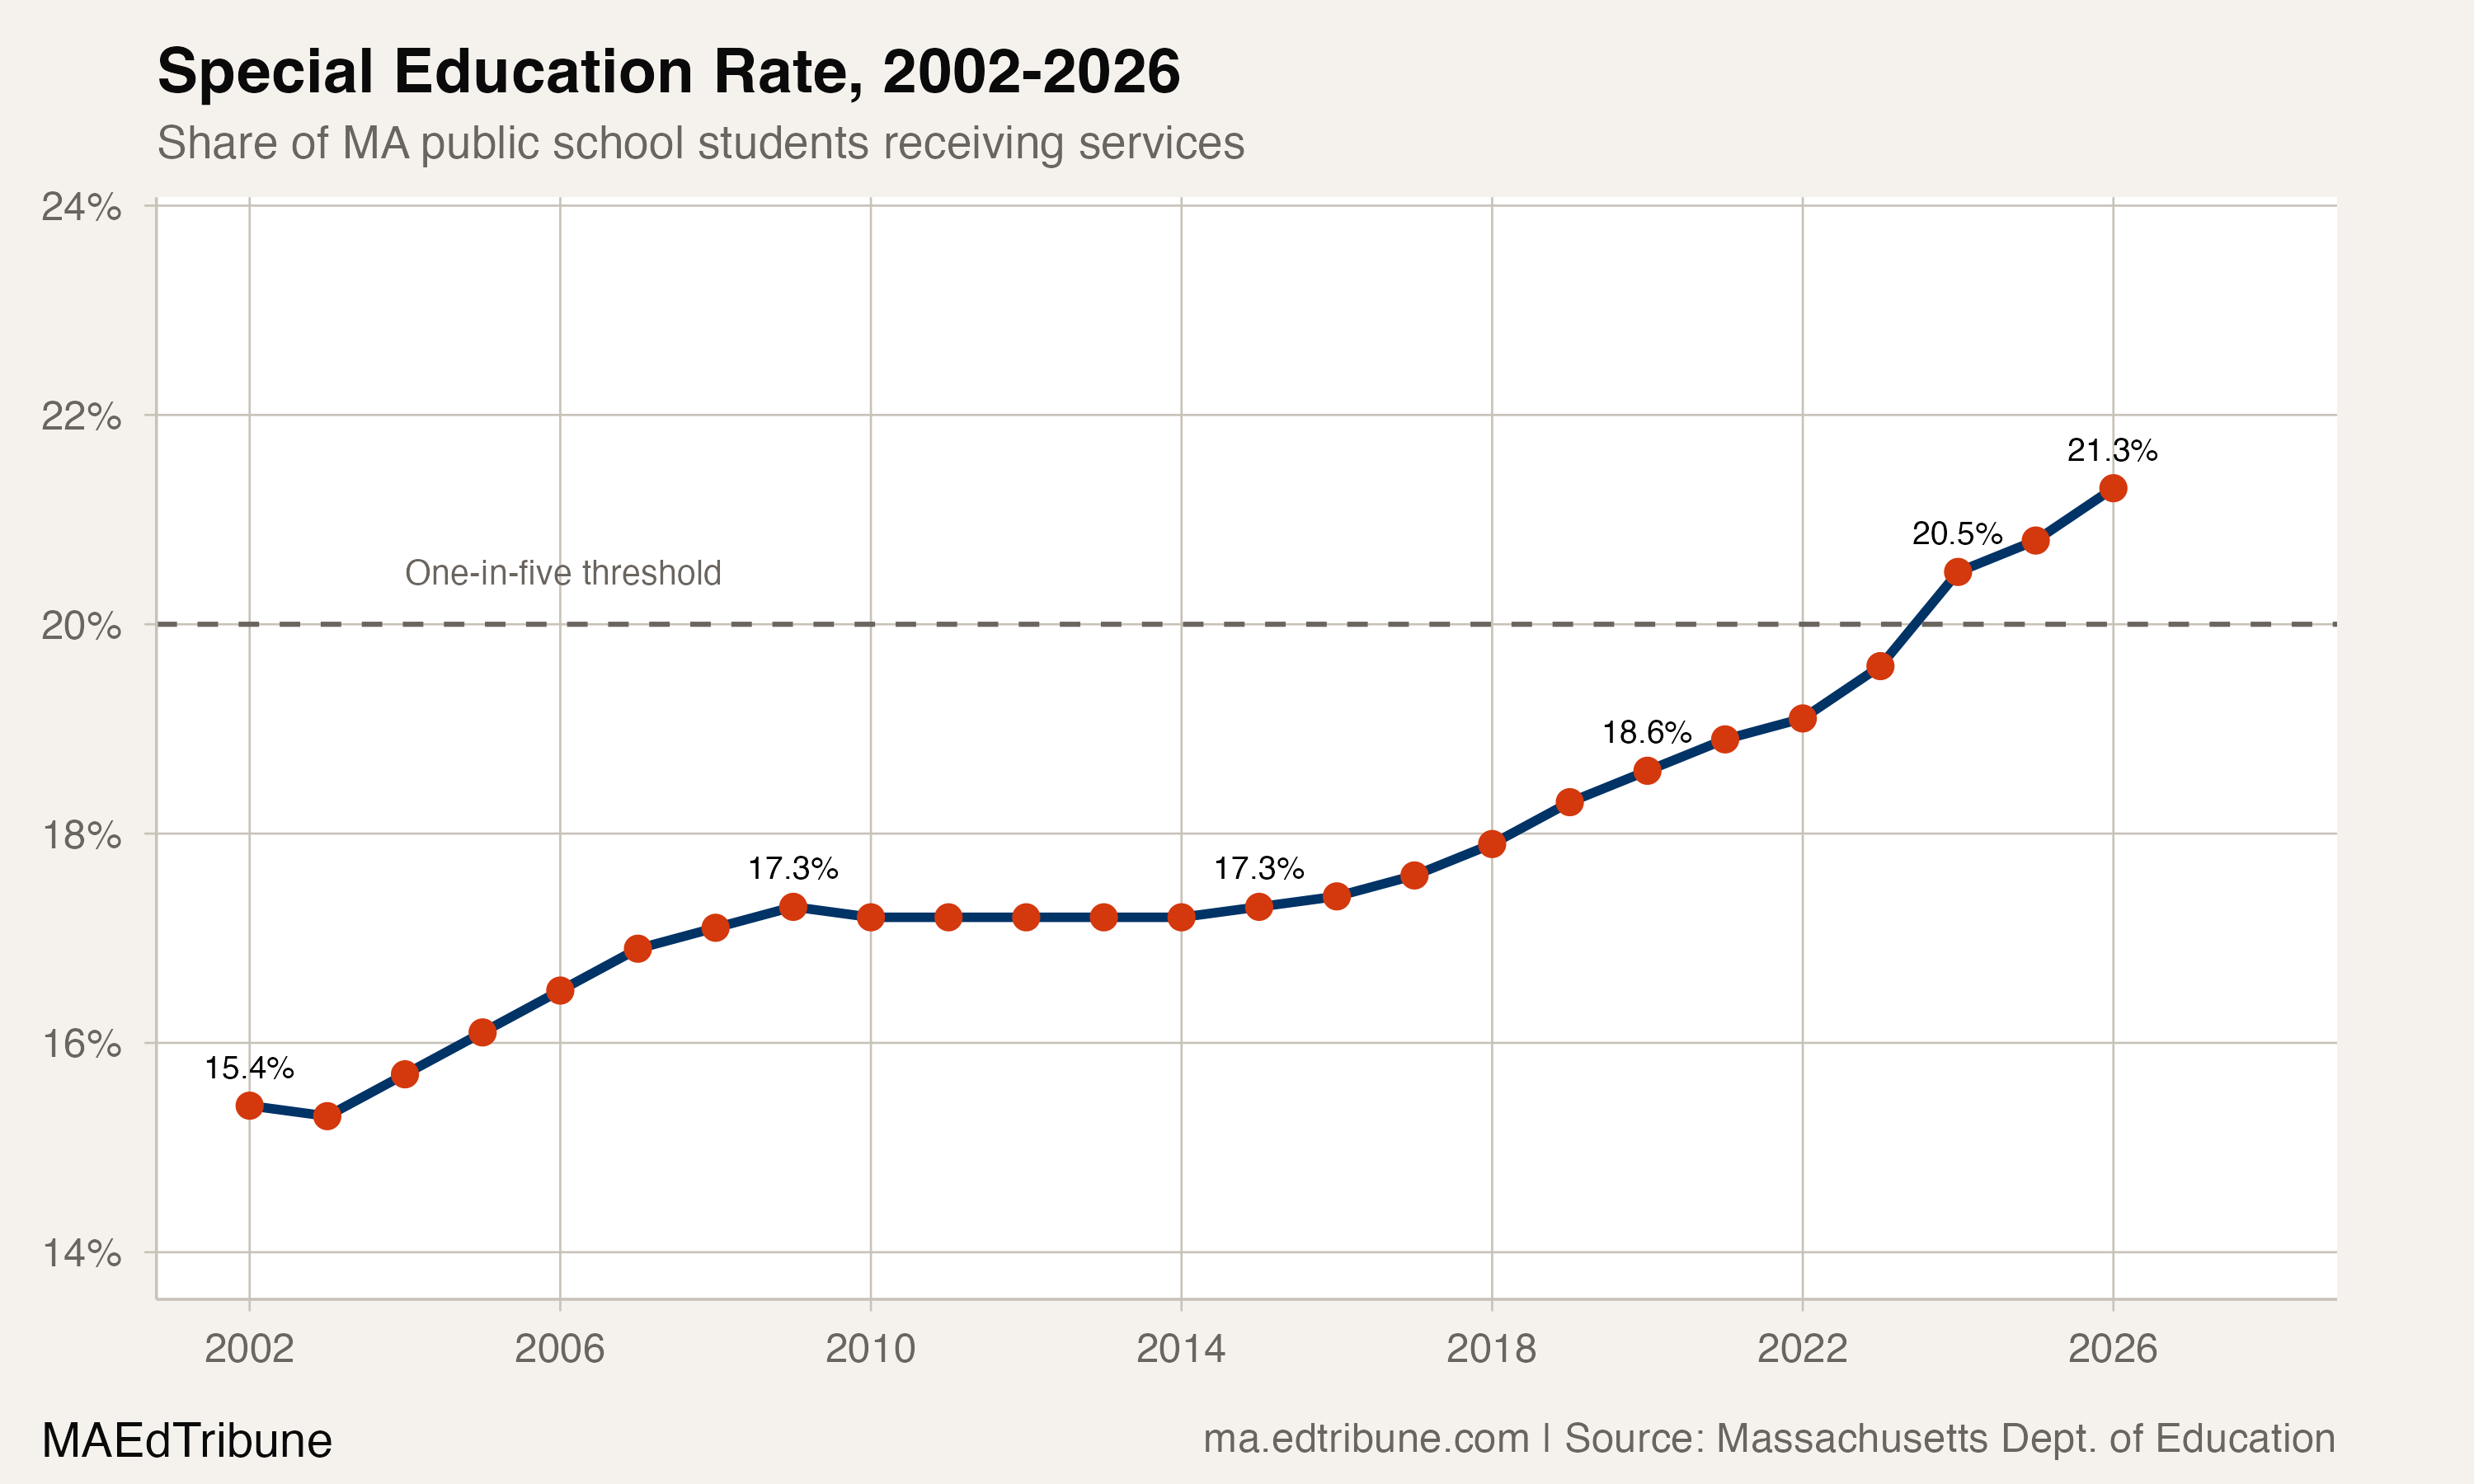
For six years, from 2009 to 2015, Massachusetts held its special education rate nearly flat. The share of students receiving services hovered between 17.2% and 17.3%, barely moving from year to year. That plateau is over.
The 2025-26 school year marks an all-time high: 192,218 students, 21.3% of total enrollment, now receive special education services. The one-in-five threshold fell two years ago and the rate has kept climbing. Massachusetts added 27,158 students to special education rolls since 2015 while losing 55,354 students from overall enrollment. The state is not growing its way into higher special education counts. It is shrinking everywhere else.
A decade of acceleration
The pace of increase has itself increased. From 2010 to 2015, the special education rate rose by 0.1 percentage points total, an era of near-stasis. From 2015 to 2020, it rose by 1.3 points, or about a quarter-point per year. Since 2020, it has climbed 2.7 points, nearly half a point per year. The rate of growth has roughly doubled in each successive period.
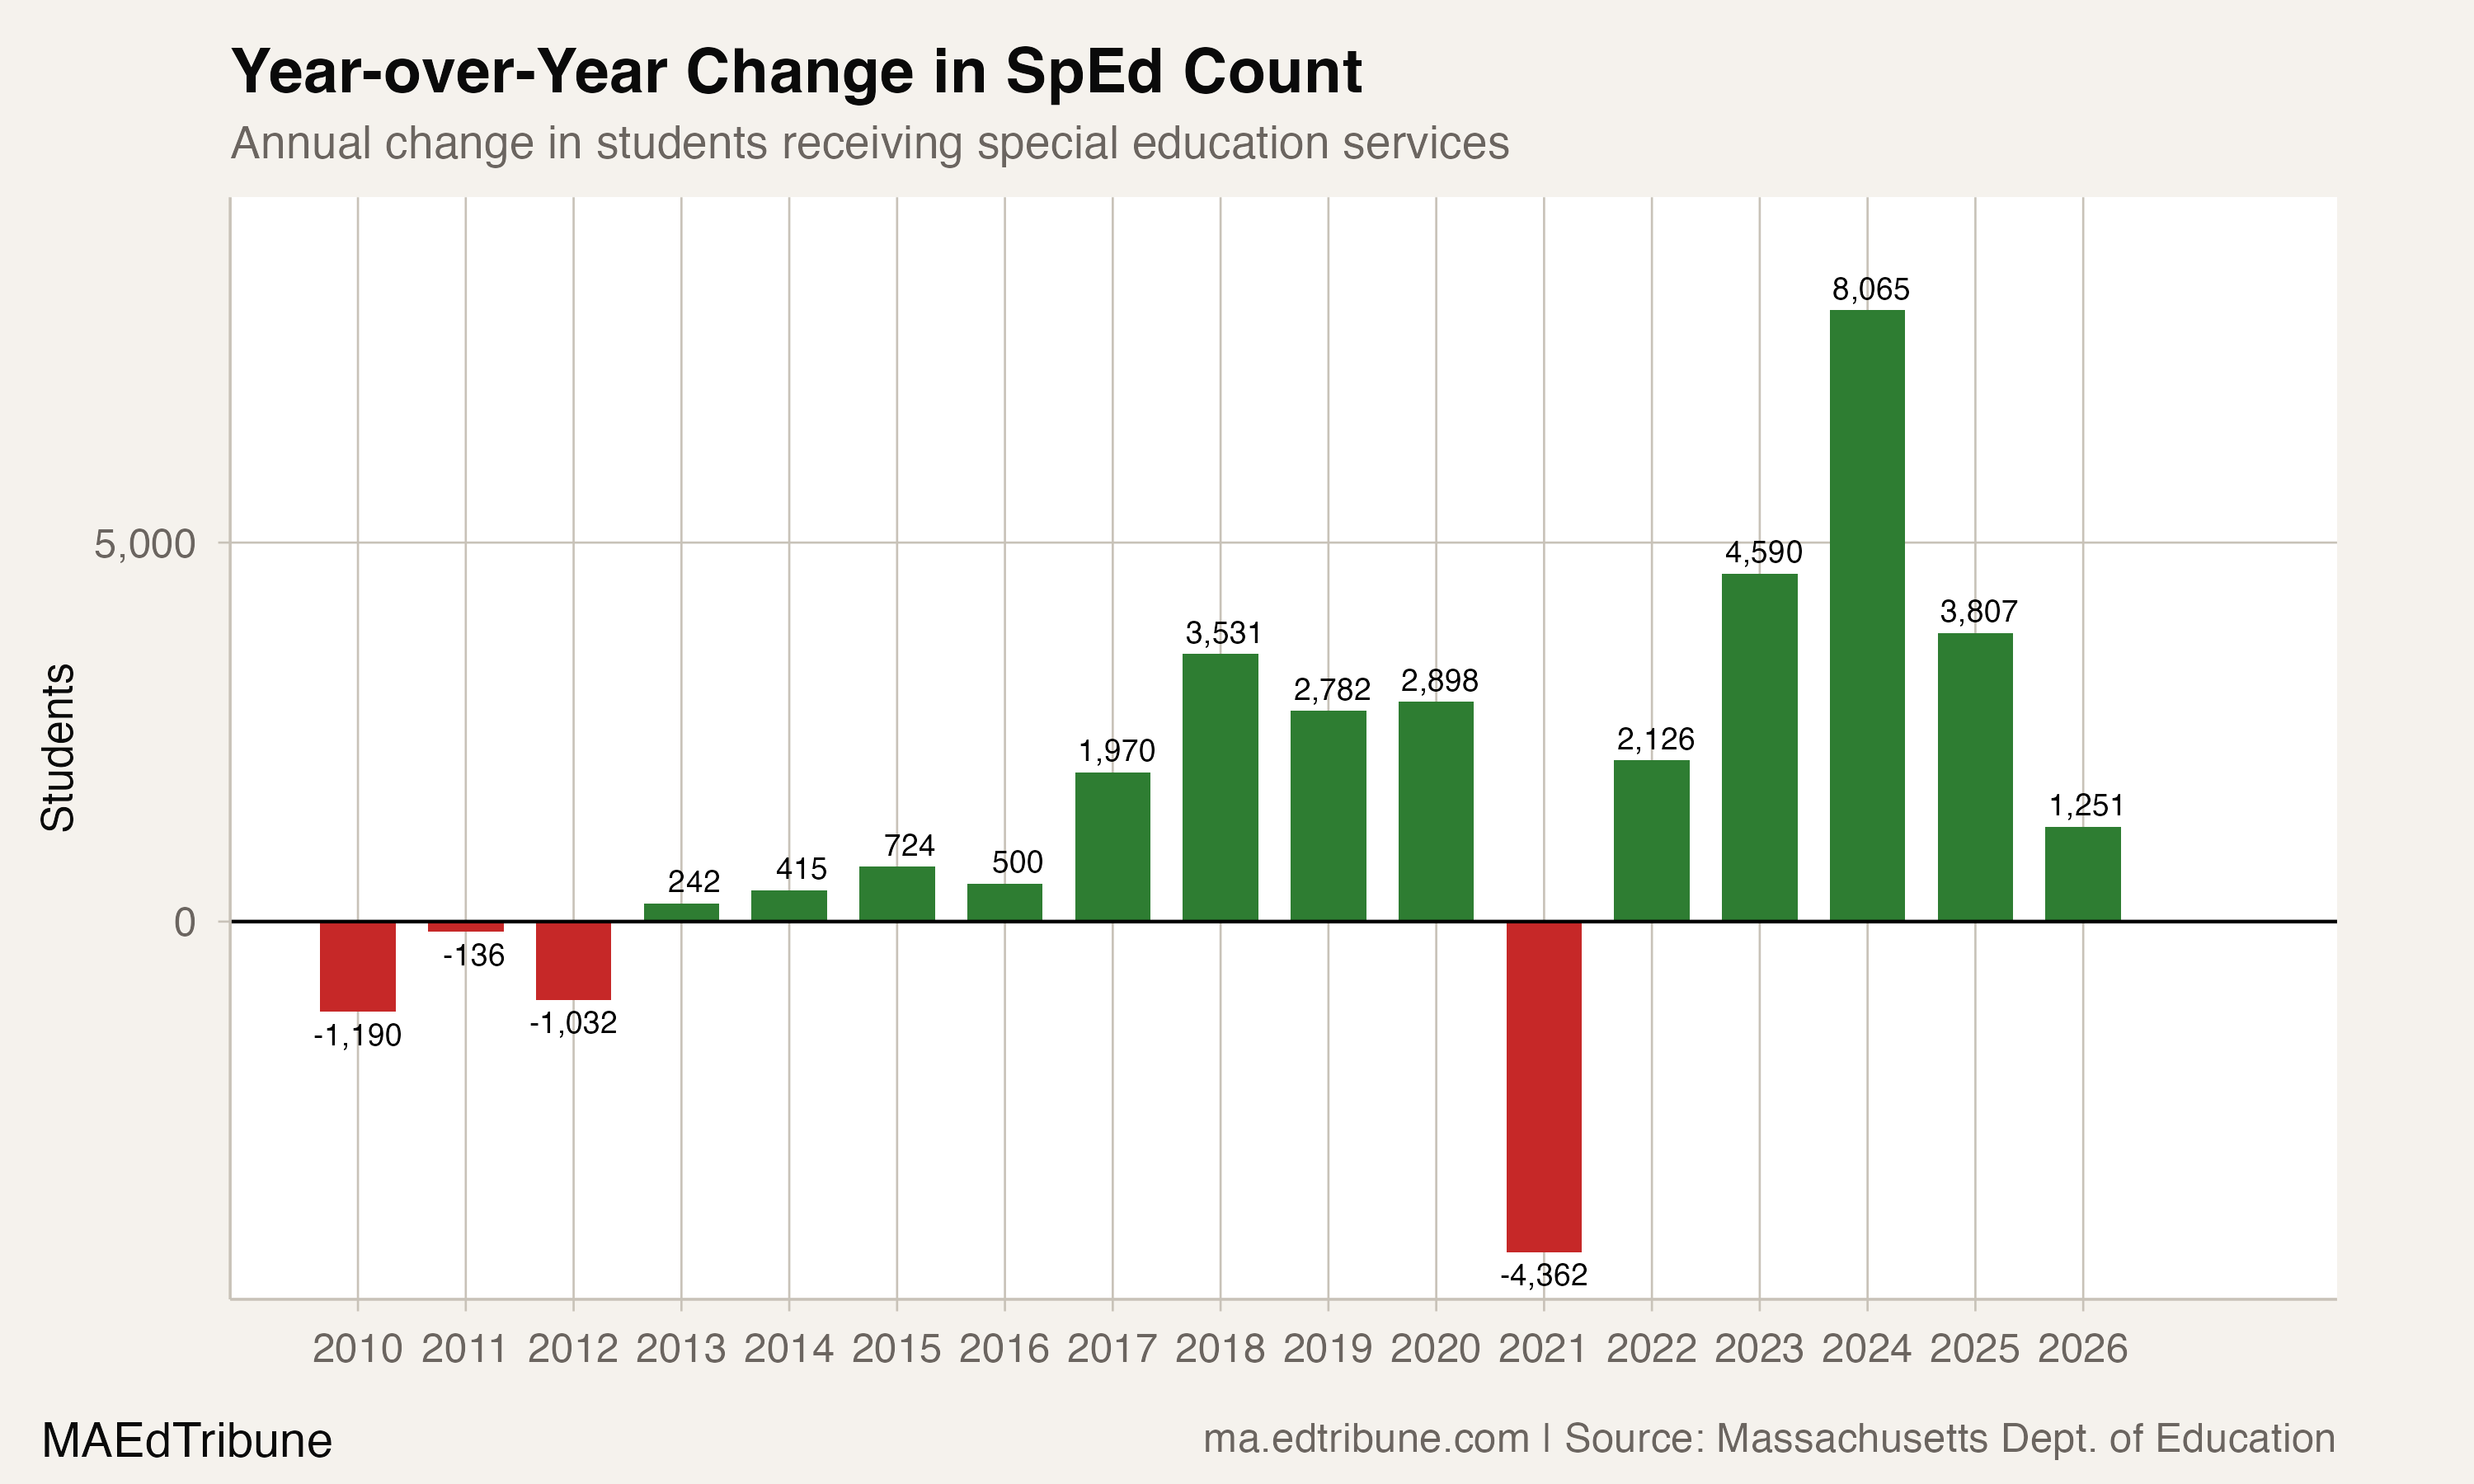
The 2023-24 school year stands out. That single year added 8,065 students to special education rolls, the largest one-year increase in the 33-year dataset, pushing the rate from 19.6% to 20.5% and past the 20% mark for the first time. The pace has slowed since: 2024-25 added 3,807 and 2025-26 added 1,251. Whether this represents a new plateau or a temporary pause is the central question for resource planning.
The structural mismatch
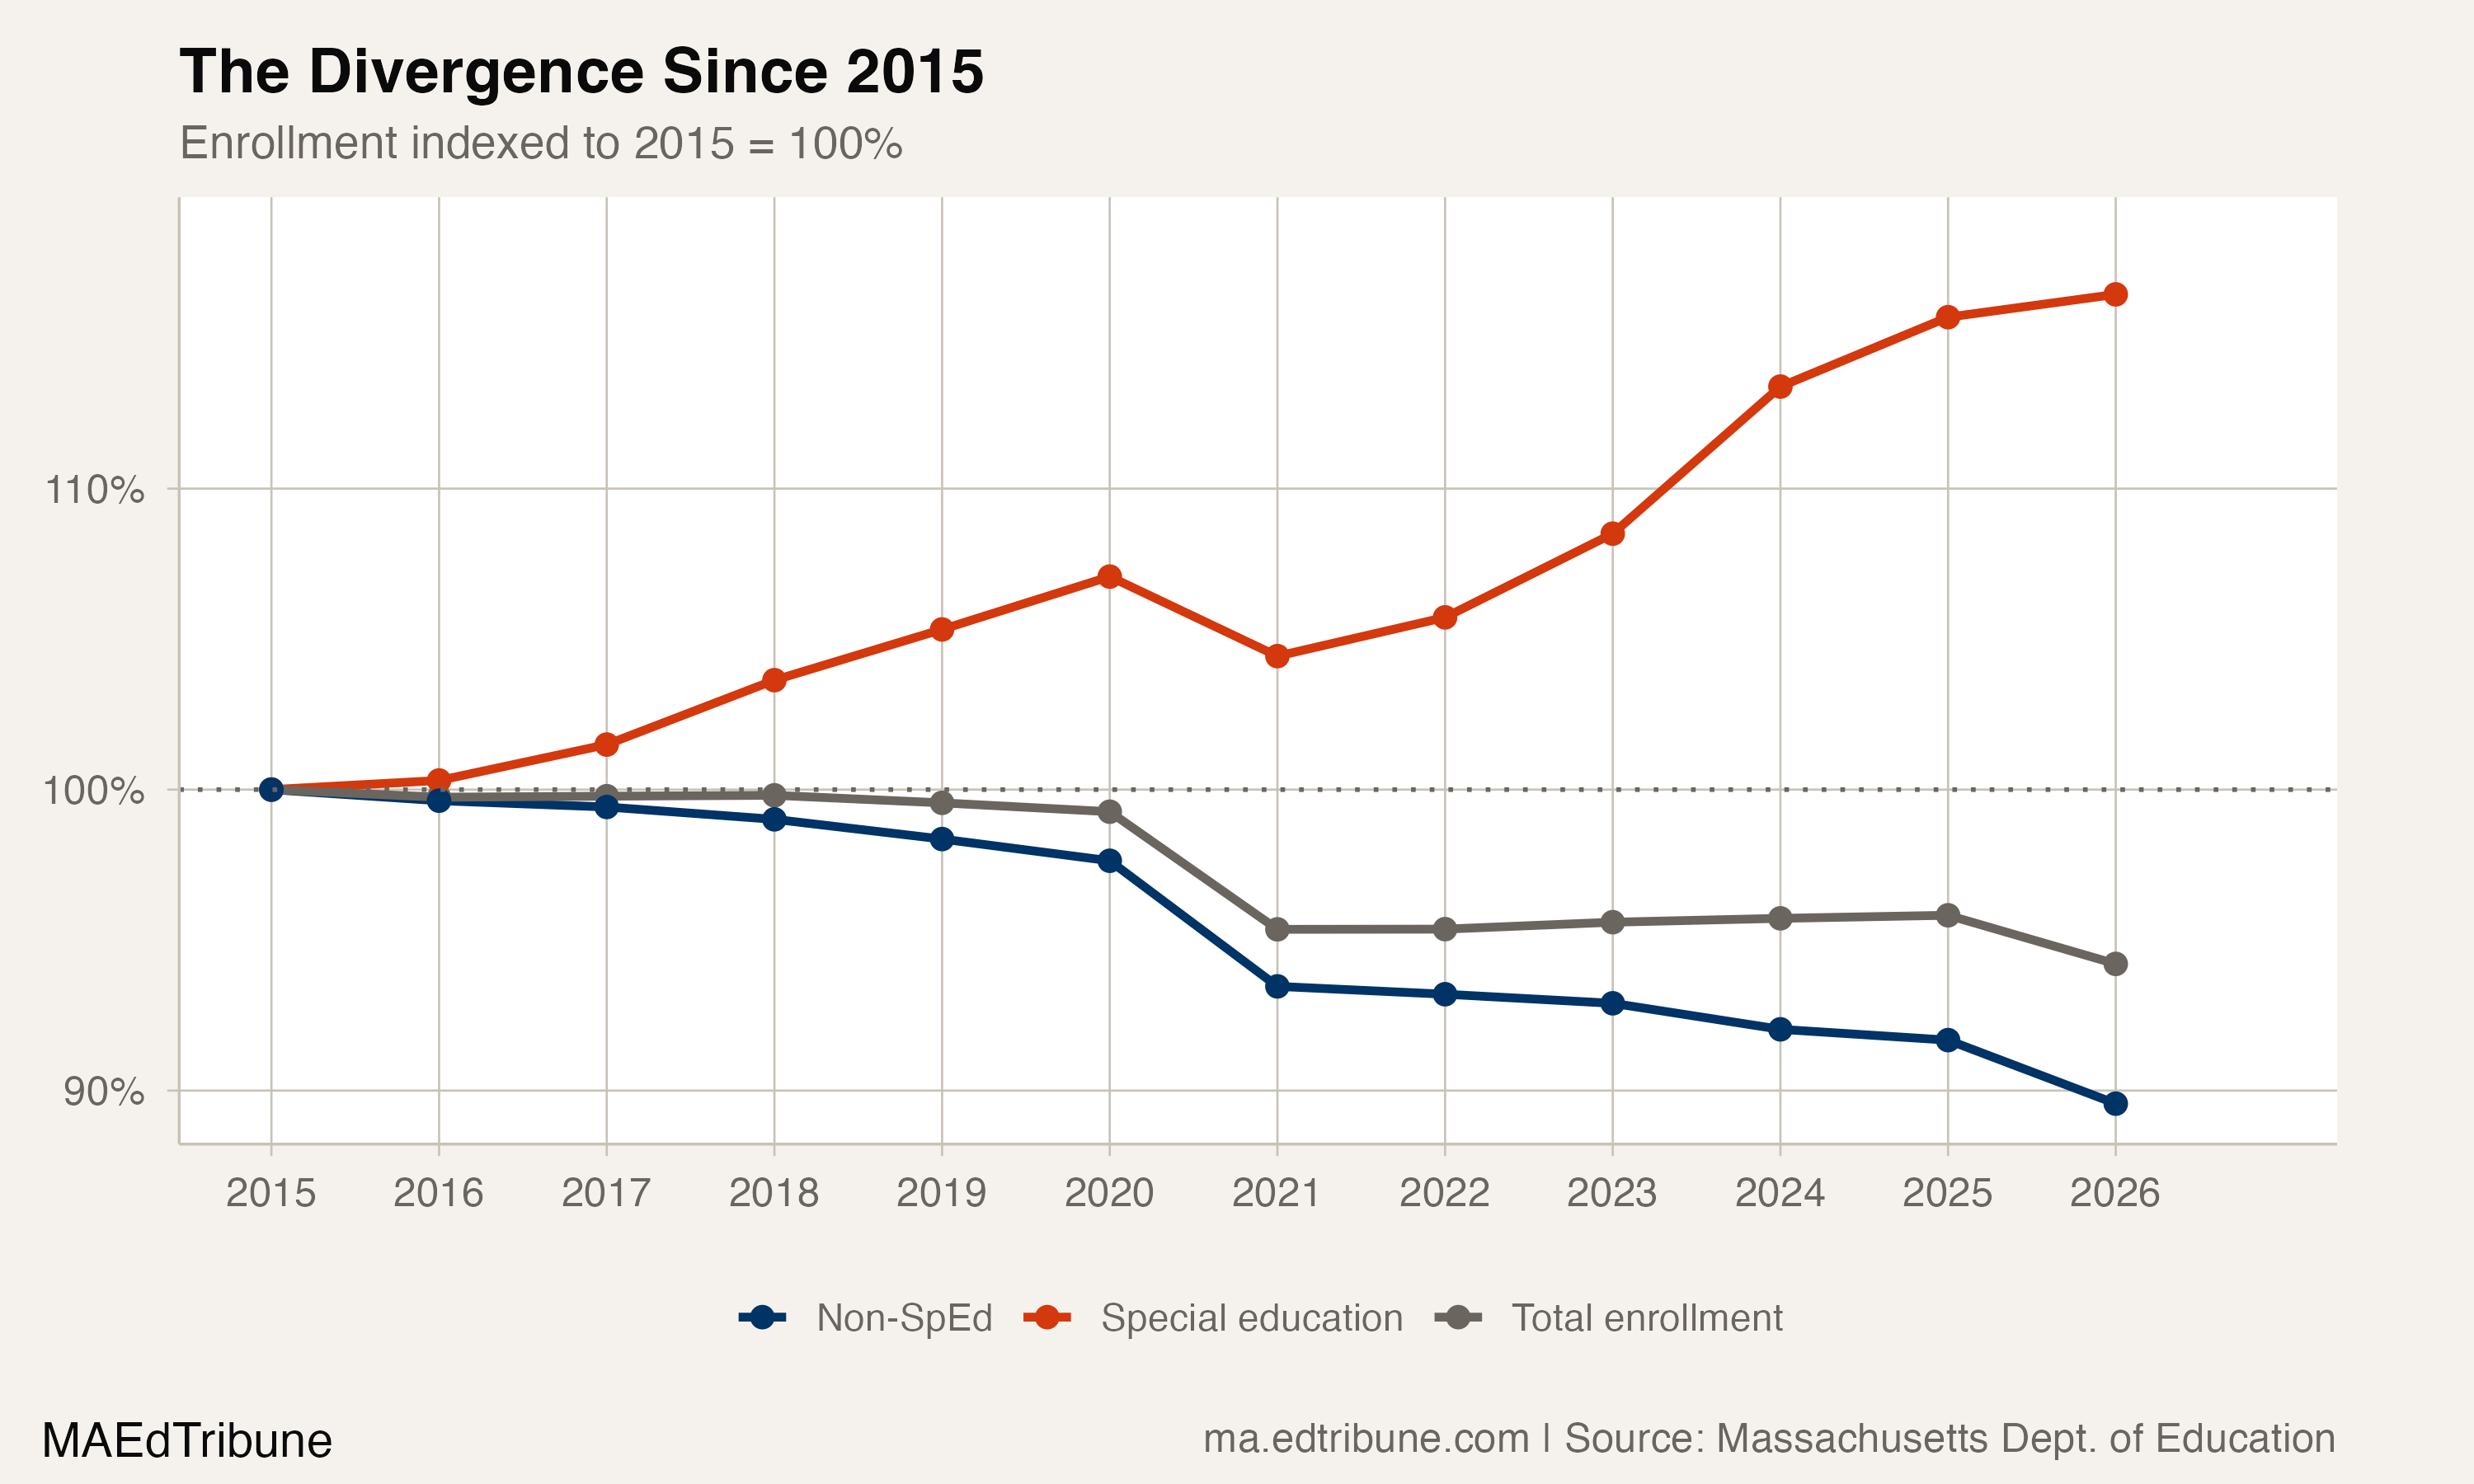
The trend is easier to understand when total enrollment is stripped out. Since 2015, the number of students not receiving special education services has fallen from 790,784 to 708,272, a loss of 82,512 students, or 10.4%. Special education enrollment rose 16.5% over the same period. The lines are moving in opposite directions, and the gap is widening.
This creates a structural mismatch between declining base enrollment and growing demand for specialized instruction. Every district in Massachusetts is budgeting for fewer students overall. Simultaneously, a larger share of those students are entitled to Individualized Education Programs, which carry higher per-pupil instructional costs, require smaller class sizes, and mandate specific staffing ratios.
Where the rates are highest
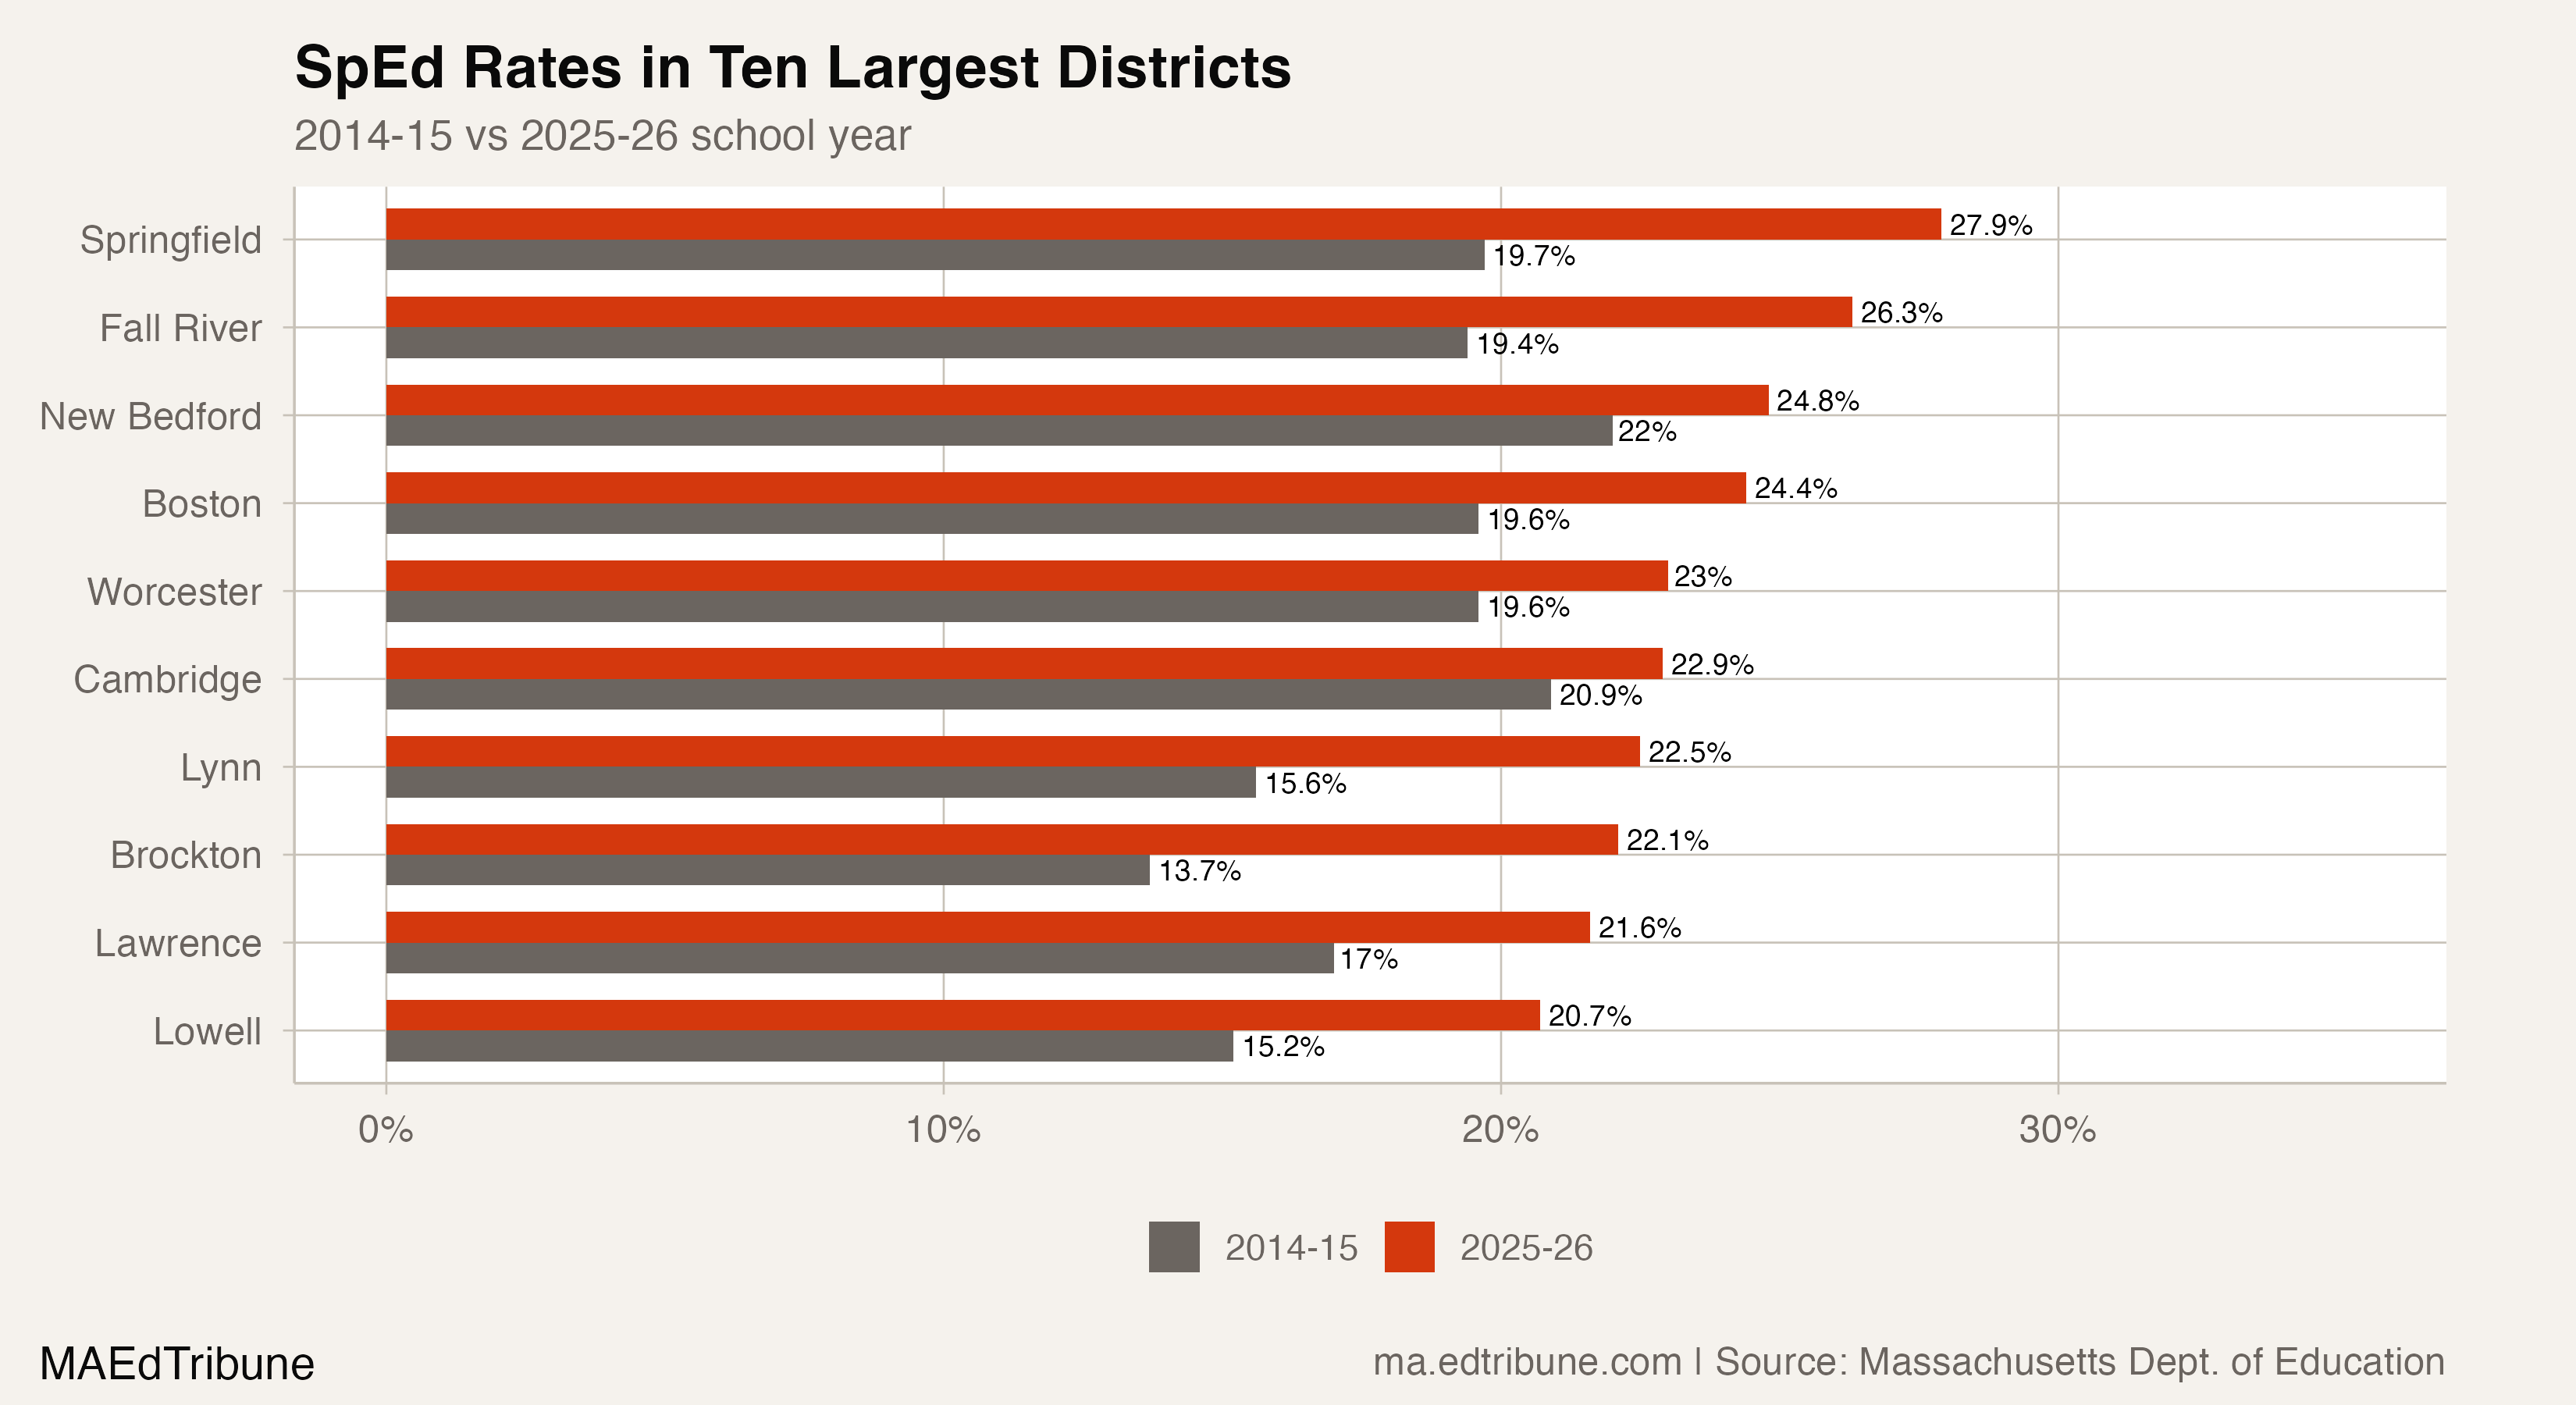
Springfield↗ET leads the state's ten largest districts at 27.9%, meaning more than one in four students receives special education services. That rate was 19.7% in 2015, an 8.2 percentage-point increase in 11 years. Fall River↗ET is close behind at 26.3%, up from 19.4%.
Brockton↗ET saw the steepest acceleration among large districts: its rate jumped from 13.7% to 22.1%, an 8.4 percentage-point swing that took the district from well below the state average to above it. Lynn↗ET followed a similar path, climbing from 15.6% to 22.5%. Boston↗ET, the state's largest district with 10,832 students receiving services, rose from 19.6% to 24.4%.
Nine of the ten largest districts increased their special education rate since 2015. Only Newton saw a slight decline, from 19.8% to 18.5%.
Smaller districts show even more extreme rates. Holyoke↗ET stands at 33.6%, with 1,552 of its 4,619 students receiving services. North Adams is at 31.9%. Winchendon is at 31.8%. Statewide, 49 traditional public school districts exceed 25%, and 12 exceed 30%.
What is driving identification
The most likely explanation is expanded identification, not a sudden change in the underlying population. Multiple factors converge.
Massachusetts adopted broader screening practices, including universal screening tools for dyslexia and other learning disabilities that flag students who might previously have gone unidentified. Nationally, autism and developmental delay are the fastest-growing IDEA disability categories, and Massachusetts has among the highest autism prevalence rates of any state. The state's strong parental advocacy culture and relatively robust appeal process likely push identification rates higher than states with weaker procedural safeguards.
The pandemic also played a role. Research from Michigan found that special education identifications fell 19% in K-5 during 2019-20 and 12% in 2020-21, then rebounded sharply as schools returned to in-person instruction. Massachusetts shows this same pattern: the 2020-21 count dropped by 4,362, then surged by 14,781 over the next three years as pandemic-deferred evaluations worked through the system. The 8,065-student spike in 2023-24 likely reflects the tail end of that backlog.
The growth may also reflect genuine increases in student need. Pandemic-era disruption hit child development hard, particularly in speech and language, social-emotional regulation, and early literacy. The aggregate data cannot separate identification catch-up from real increases in need, and both are probably at work.
The charter gap
Charter schools in Massachusetts serve special education students at a measurably lower rate: 18.5% compared to 21.5% in traditional public schools. Both sectors have increased their rates since 2015, when charters were at 13.8% and traditional schools at 17.4%. But the 3.0 percentage-point gap has persisted.
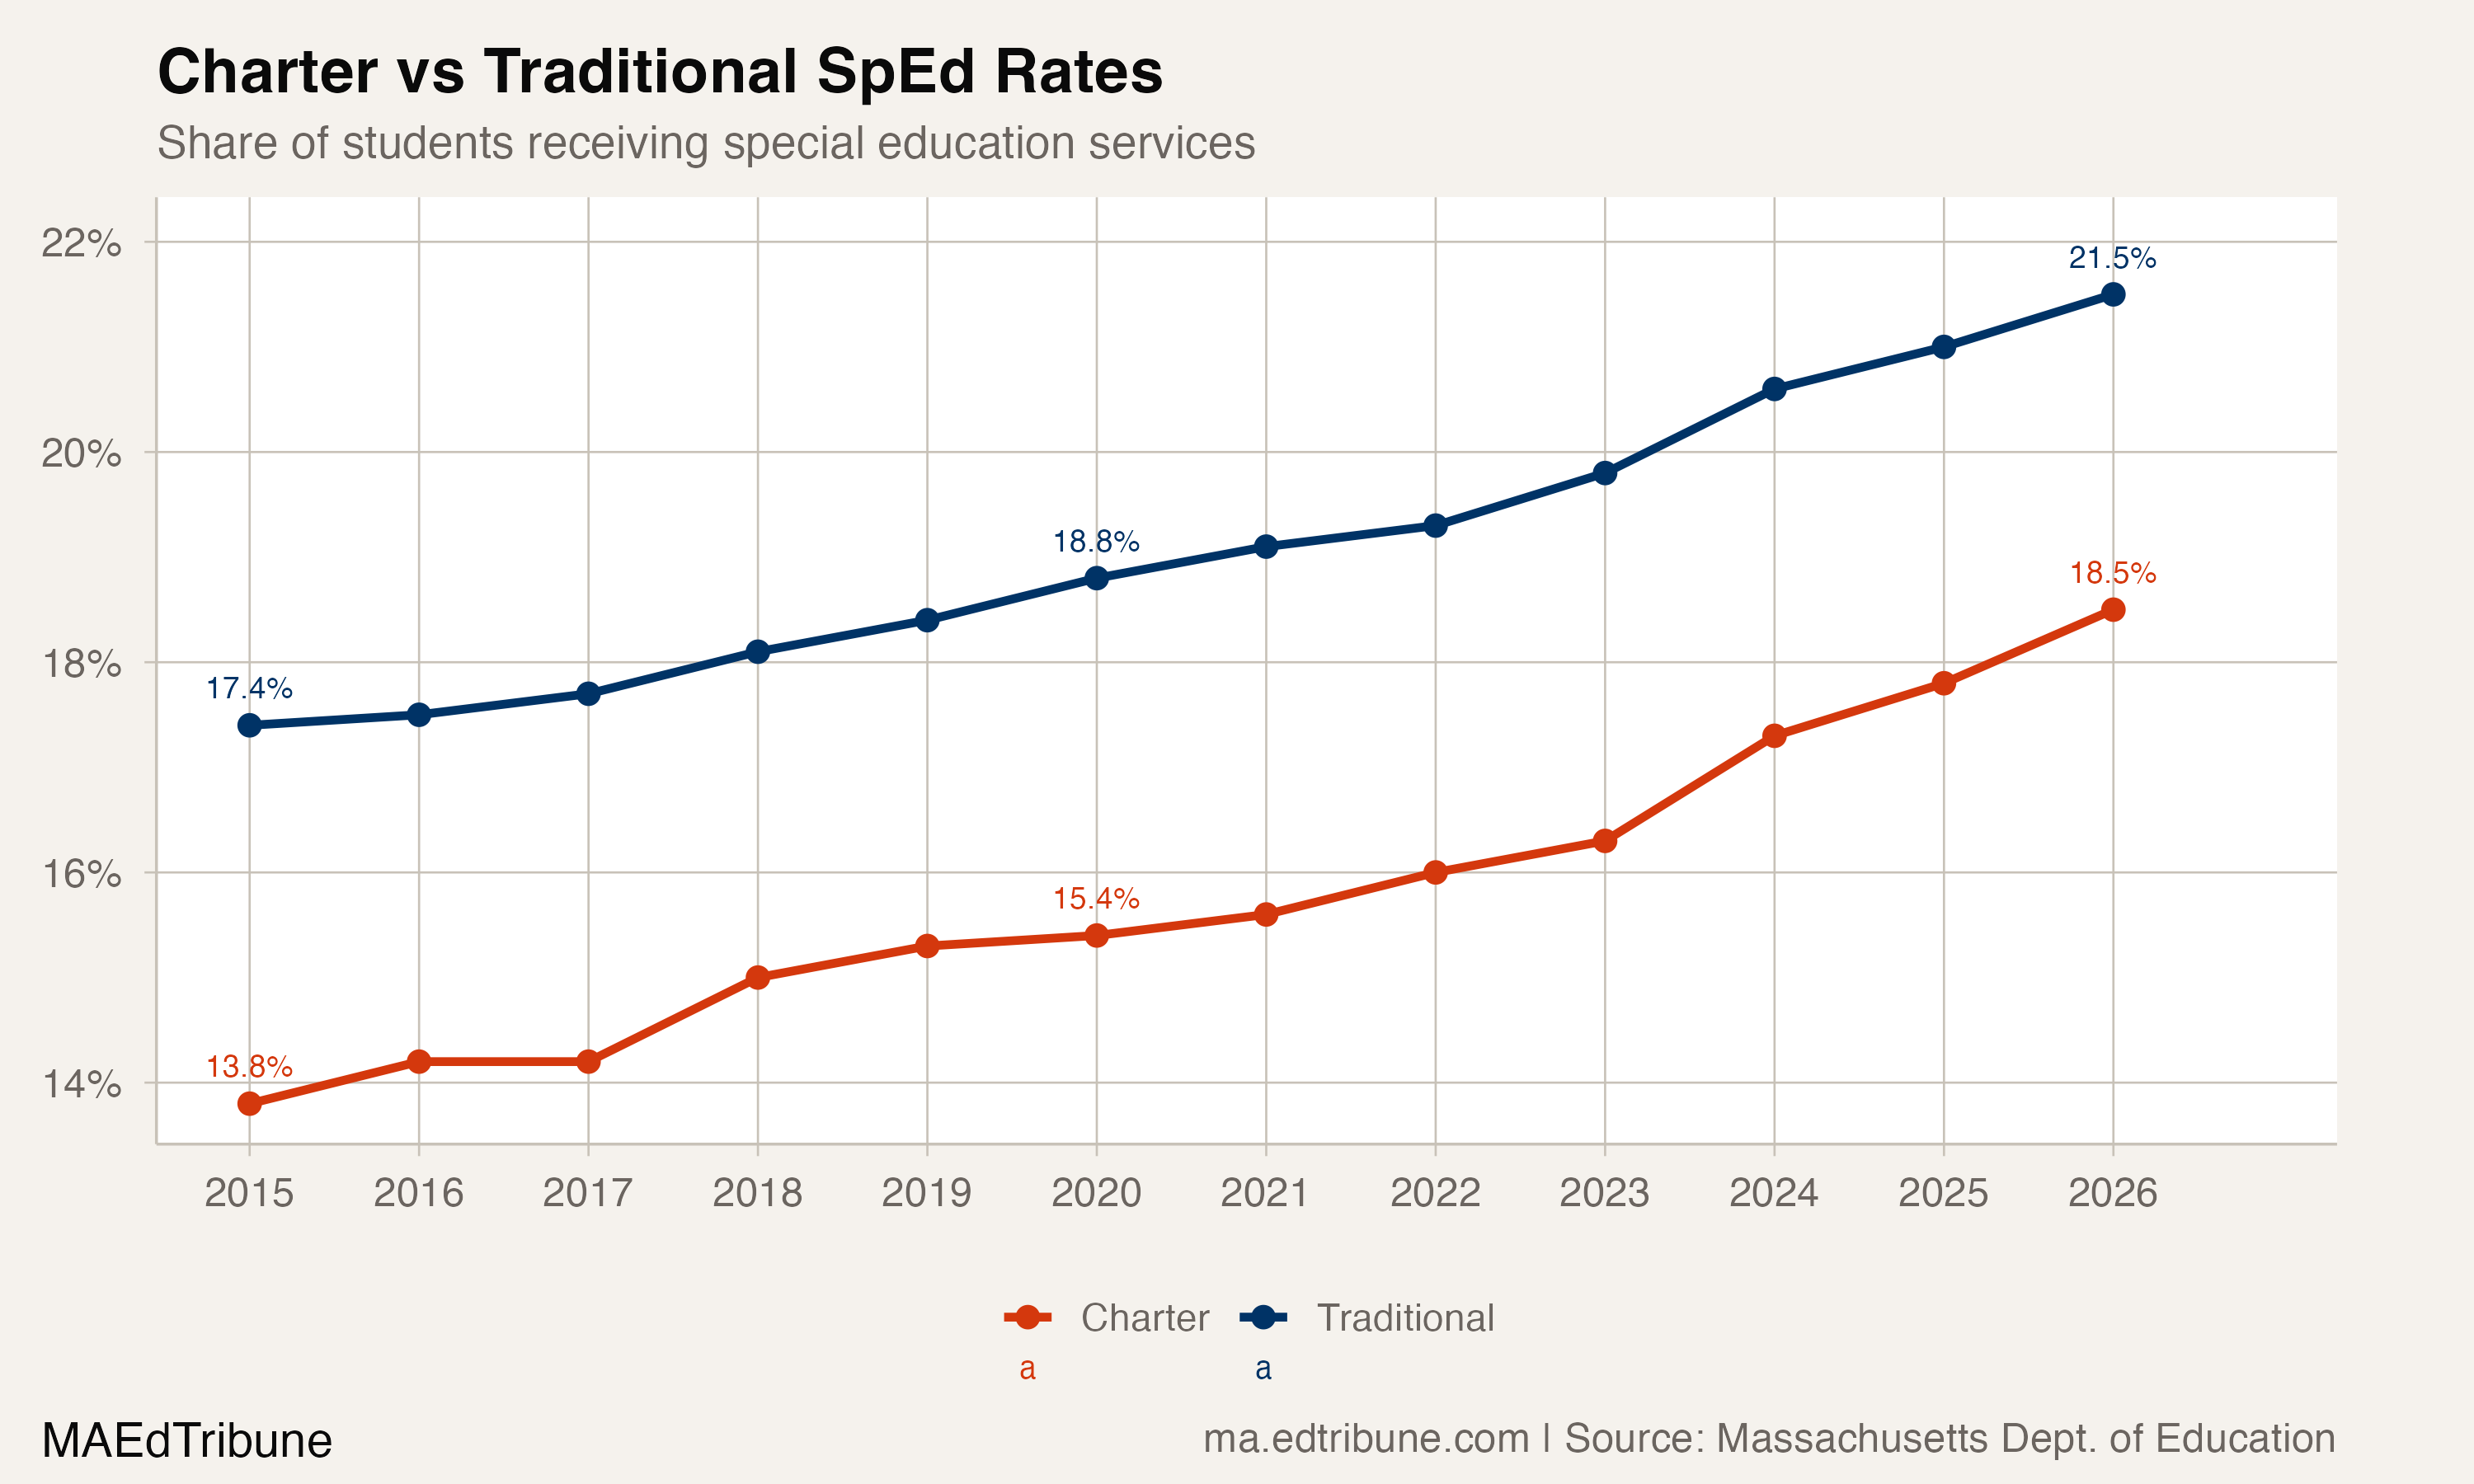
This gap has been a persistent point of contention. Charter advocates note that families of students with complex needs may self-select into traditional schools with established programs. Critics counter that some charters have historically counseled out students with significant disabilities. The data cannot resolve this debate, but the gap itself is a fact: charter schools educate a student population that is less likely to have an IEP, and that difference has not narrowed.
The cost question
Massachusetts already ranks among the highest-spending states per pupil, and special education is the most expensive category of instruction. The fiscal pressure shows most clearly in transportation. In fiscal 2024, districts transported 61,996 students to special education programs at an average cost of $13,825 per student, compared to $1,045 for general education students, a 13-fold difference. Massachusetts places students in out-of-district programs at nearly three times the national rate: 6.1% versus 2.3%.
The state's Inspector General reported in February 2026 that districts must pay transportation costs upfront and wait for reimbursement that, in fiscal 2025, covered only 61.36% of qualifying expenses rather than the statutory 75%.
"Four previous reports on the same problem over the past 20 years have largely been ignored." — Massachusetts Inspector General, February 2026
The state's FY2026 budget includes $675 million for the Special Education Circuit Breaker, a record. That number will need to keep growing. At 21.3% and rising, every incremental percentage point translates to roughly 9,000 additional students entitled to services that cost substantially more than general instruction.
192,218 IEPs and counting
The 2023-24 spike of 8,065 students appears to be subsiding. The last two years added 3,807 and 1,251 respectively, a deceleration that could mean the pandemic-deferred backlog has cleared, or simply that districts are catching their breath before the next wave of referrals.
Either way, 89% of districts with enrollment over 1,000 saw their special education rate rise since 2015. This is not a handful of outliers inflating a statewide average. Springfield is at 27.9%. Holyoke is at 33.6%. The Inspector General has now published four reports on the same transportation cost problem over 20 years. At some point, the system stops absorbing incremental pressure and starts making choices it cannot take back.
Detailed code that reproduces the analysis and figures in this article is available exclusively to EdTribune subscribers.
Discussion
Sign in to join the discussion.
Loading comments...