In this series: Massachusetts 2025-26 Enrollment.
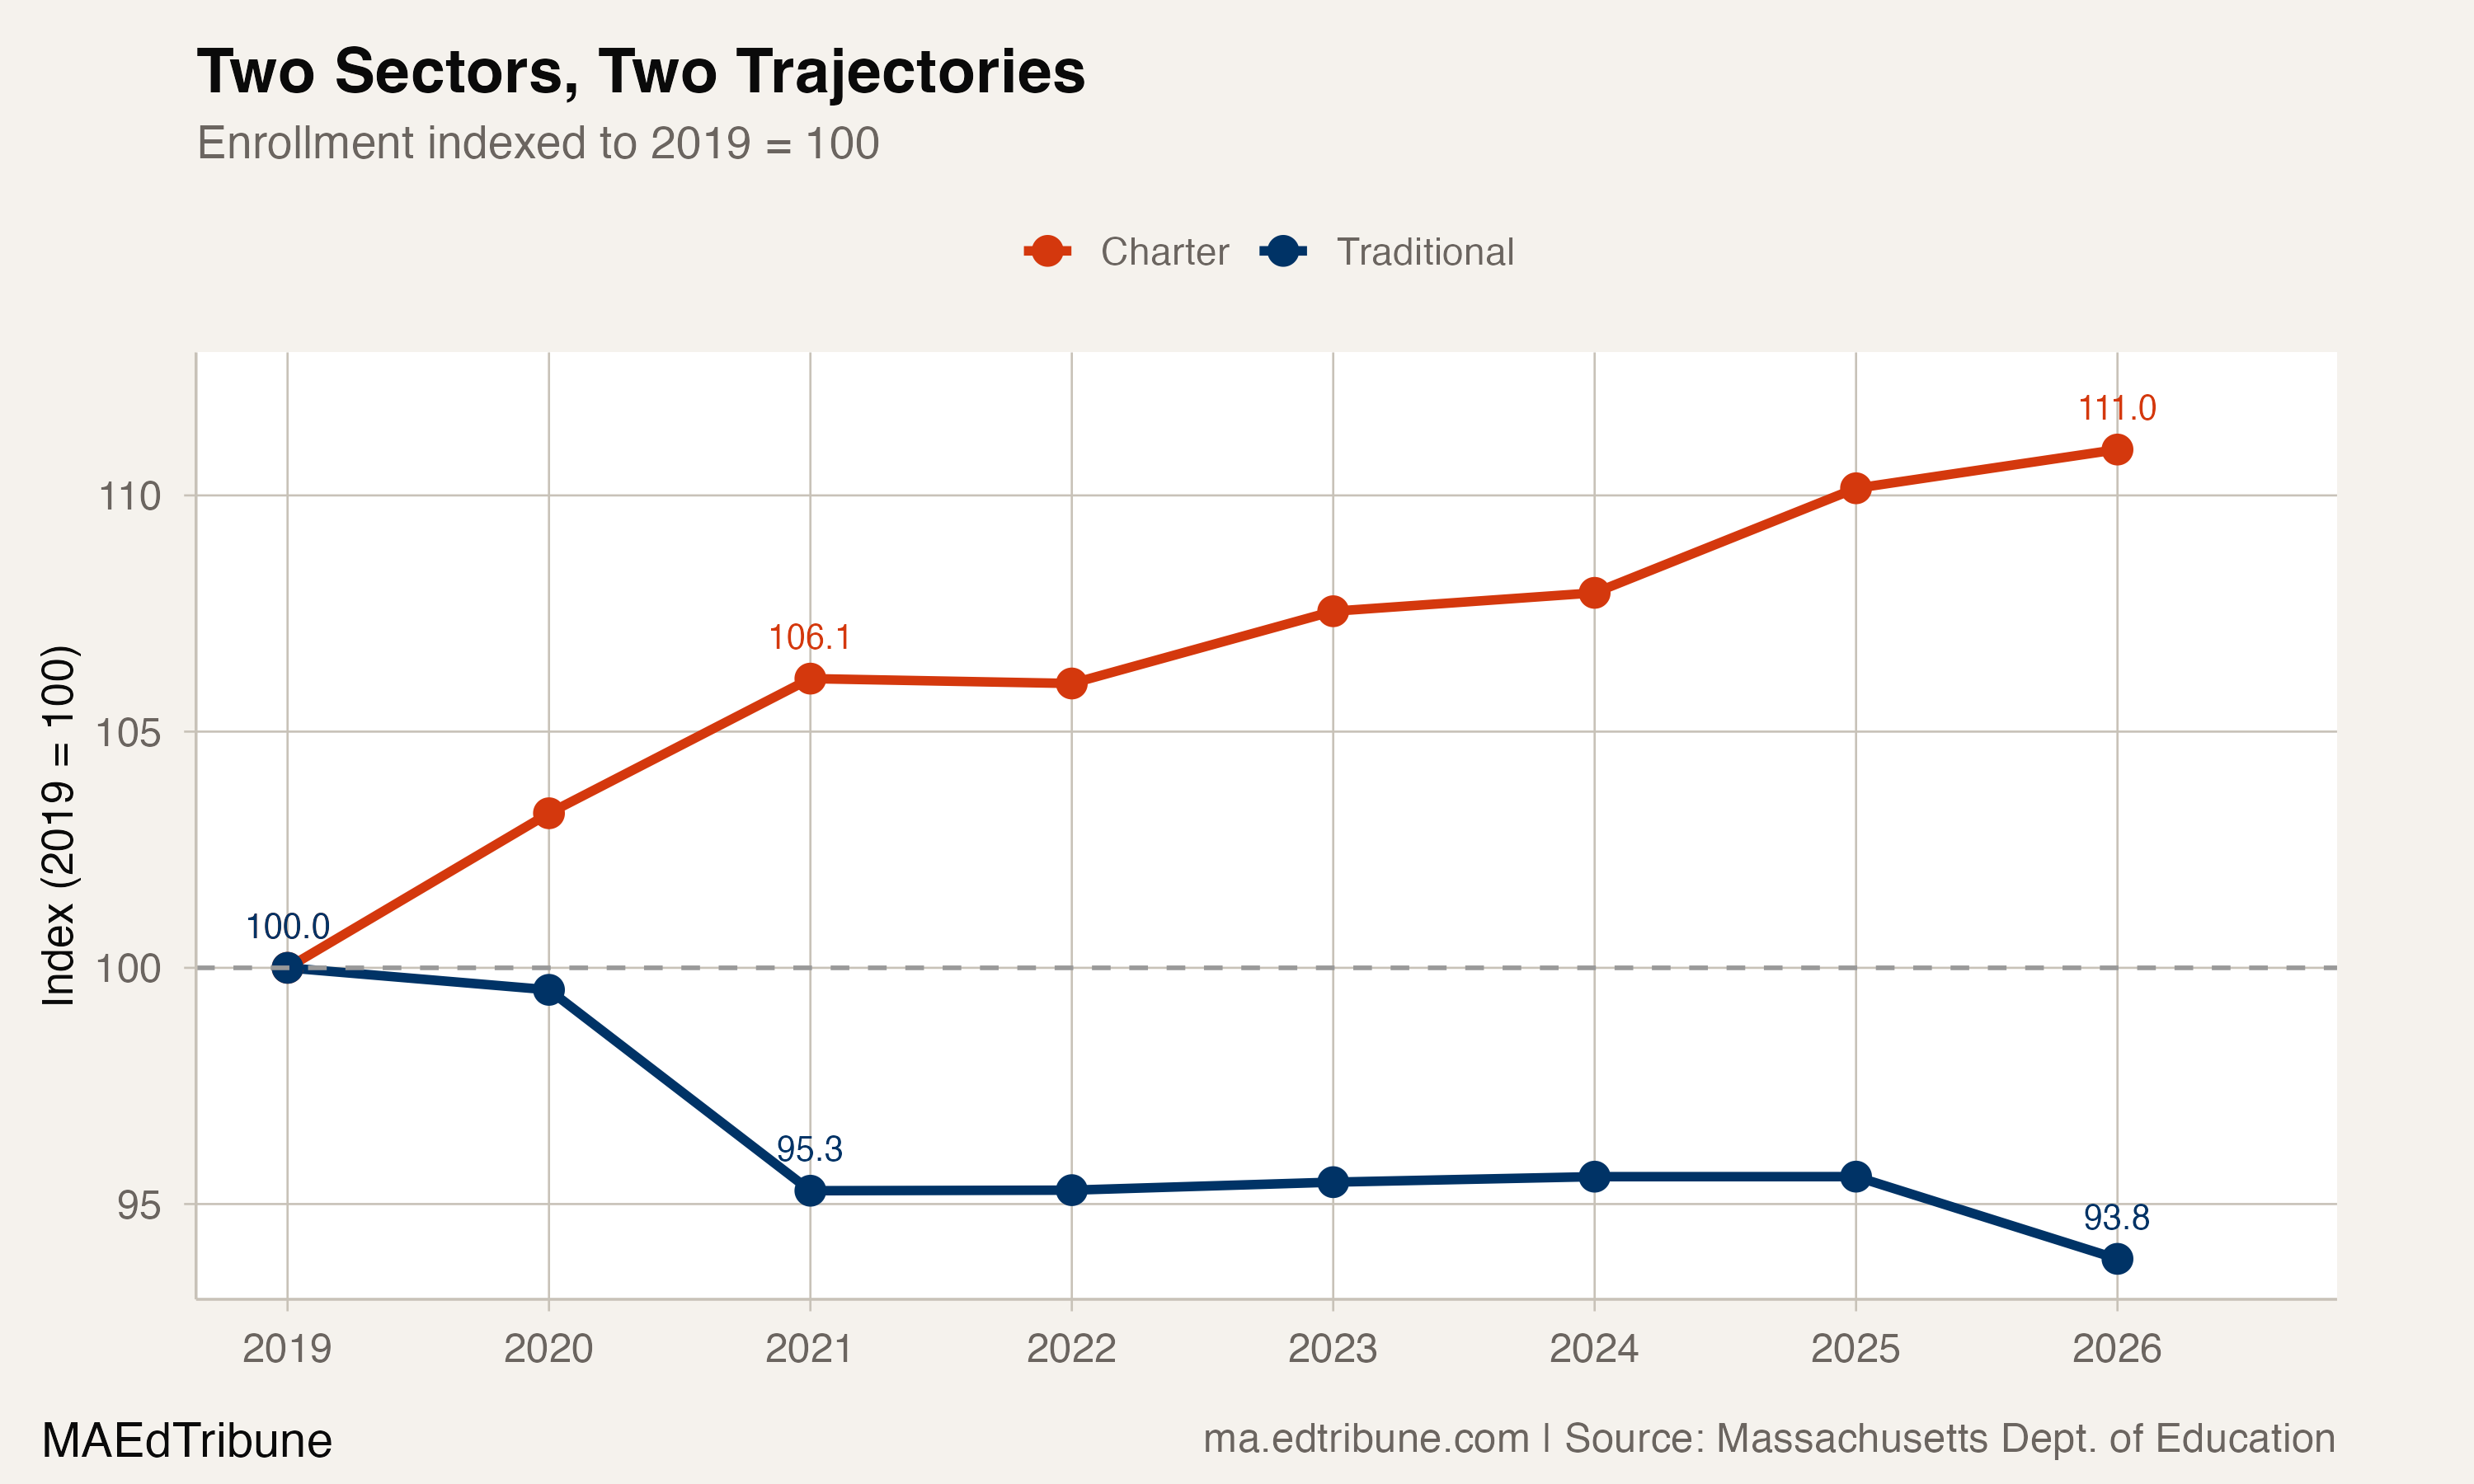
The pandemic was supposed to be the great equalizer: every school in Massachusetts closed, every family improvised, every district lost students. It was not. Between 2019 and 2021, traditional public schools hemorrhaged 42,840 students, a 4.7% loss concentrated in a single catastrophic year. Charter schools, operating under the same health restrictions in the same communities, gained 2,674 students over the same period, a 6.1% increase.
Five years later, the gap has not closed. It has widened. Charter enrollment in 2025-26 stands at 48,472 students, up 11.0% from its 2019 baseline. Traditional enrollment sits at 852,018, down 6.2% and falling again after four years of fragile stabilization.
The cap that shapes everything
Massachusetts is not a state where charter schools can grow freely. Voters rejected Question 2 in 2016 by a 62-38 margin, preserving a cap that limits how many charter schools can open and how fast existing ones can expand. The sector has operated under that constraint ever since.
The result is visible in the numbers: the state had 66 charter entities in 2016, 71 in 2019, and 72 in 2026. Growth comes almost entirely from existing schools enrolling more students within their authorized limits, not from new schools opening. Charter share has climbed from 3.7% in 2016 to 4.6% in 2019 to 5.4% in 2026. Steady, but slow.
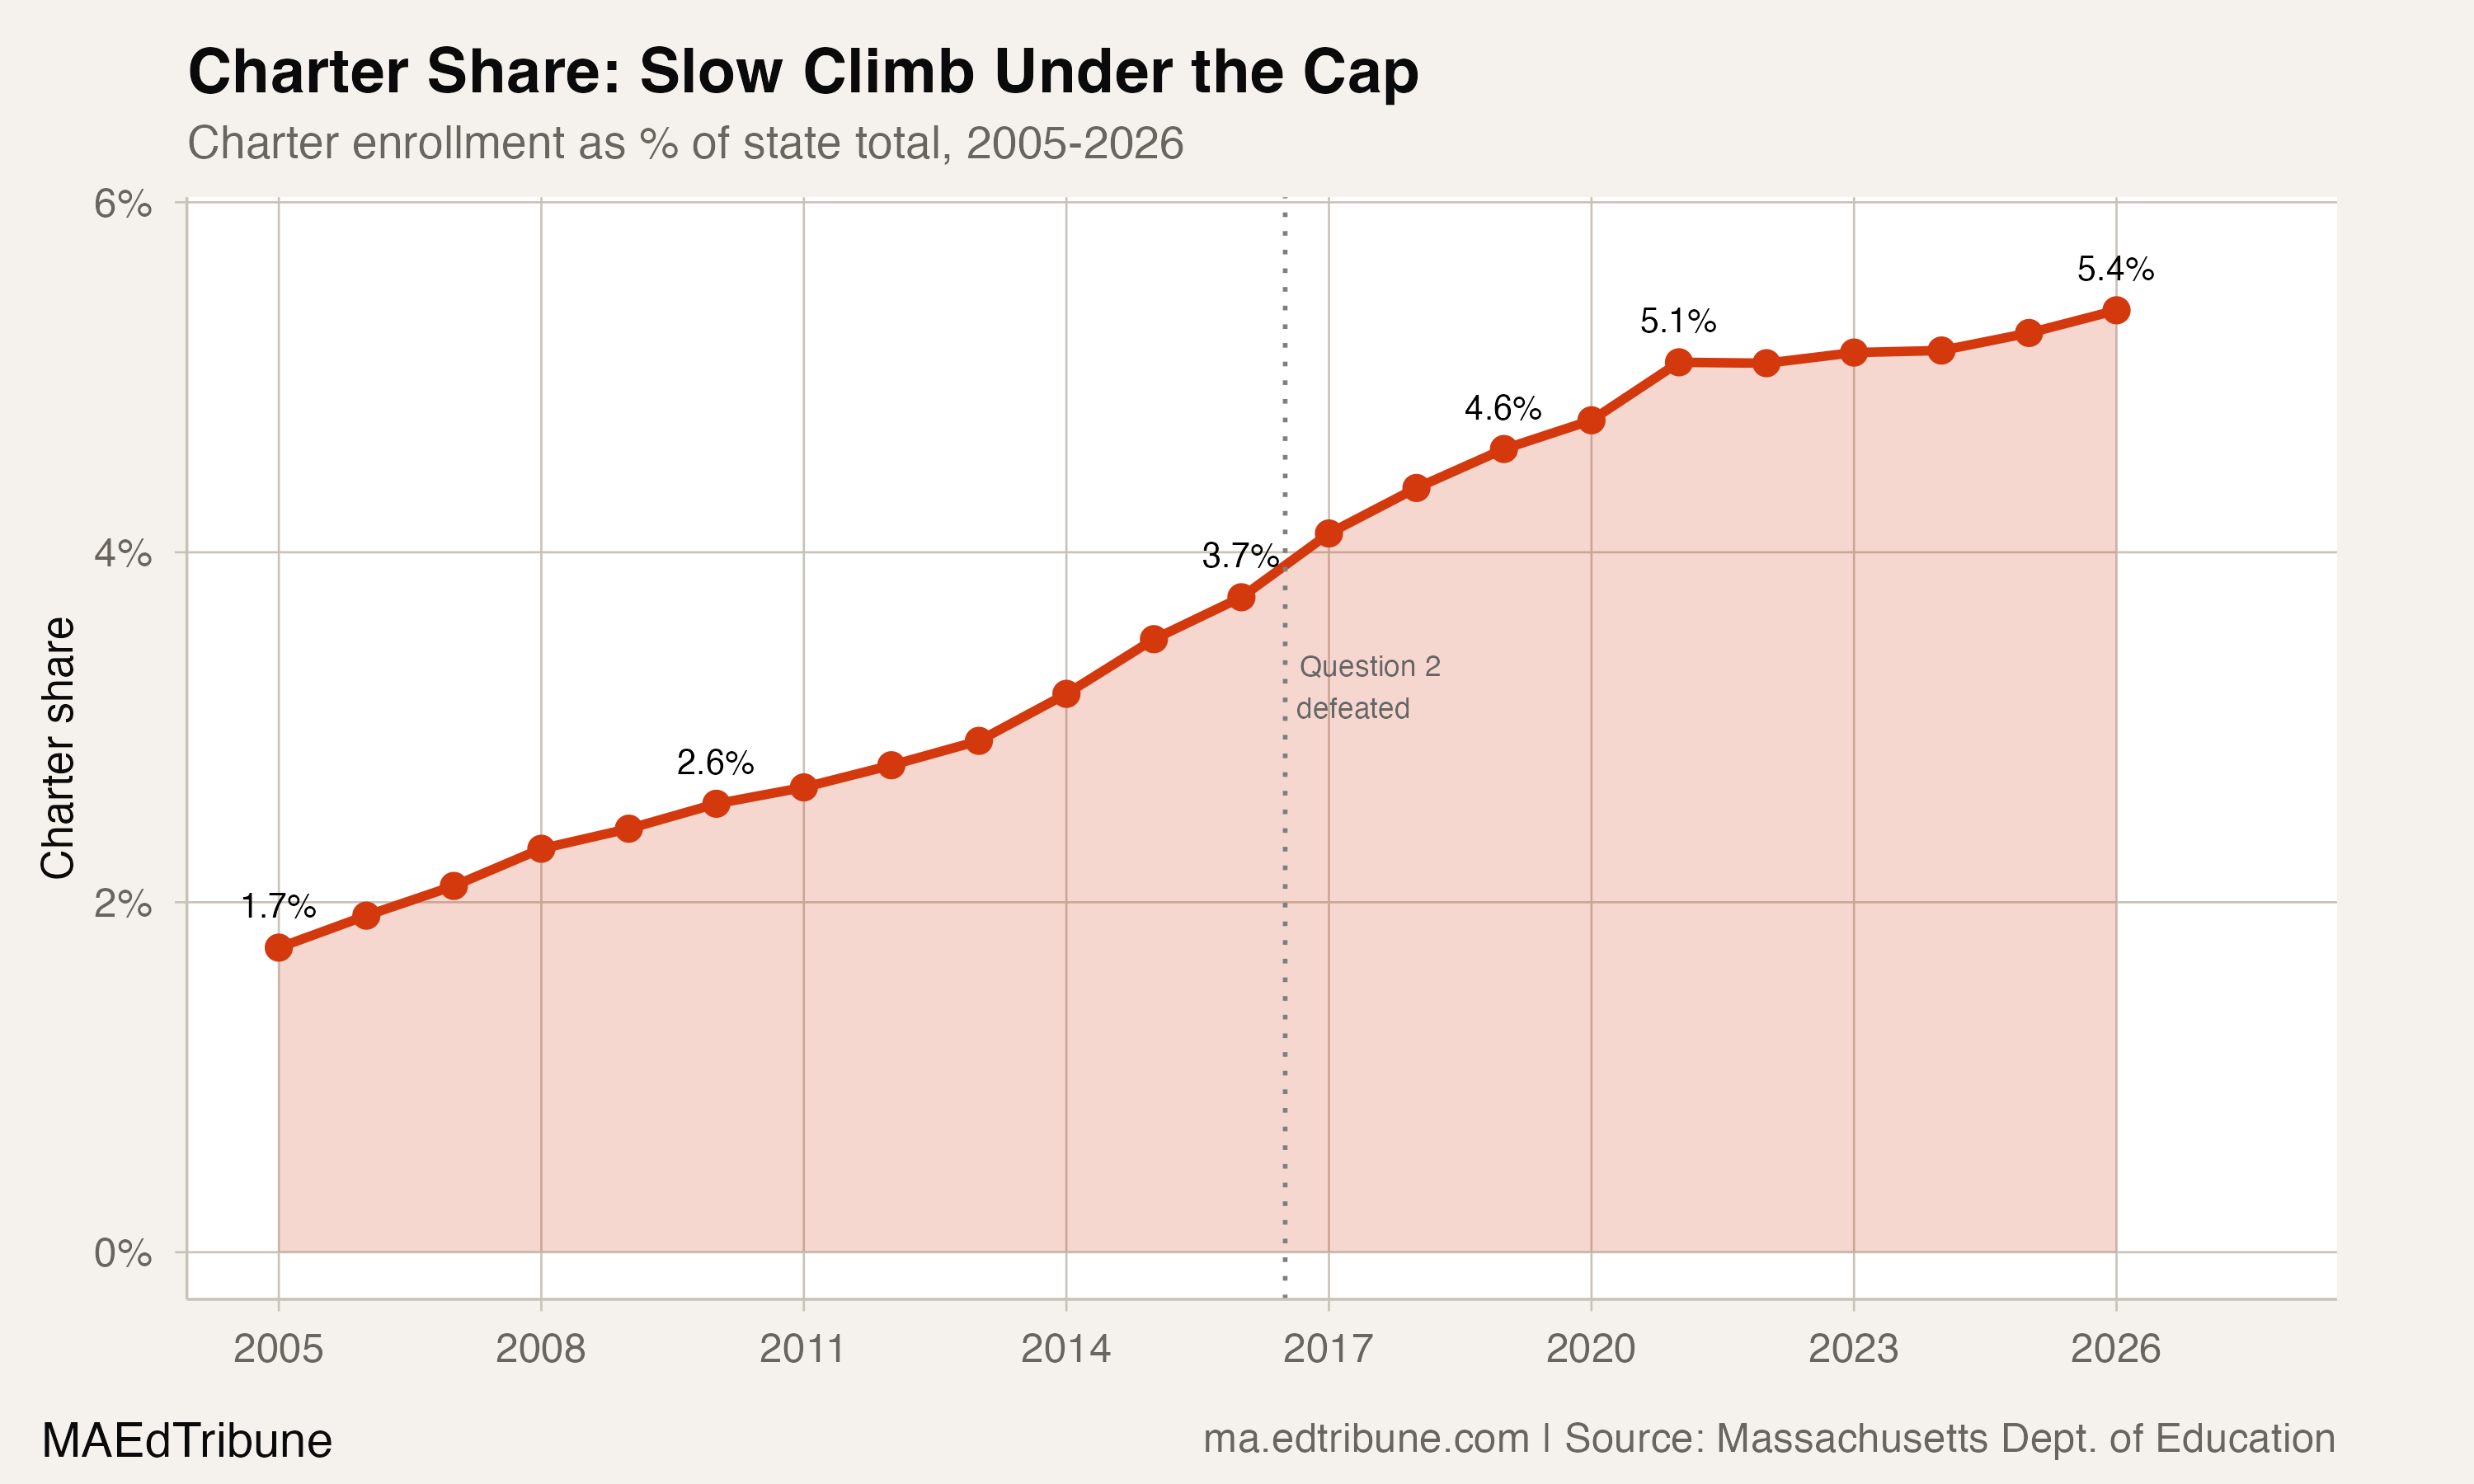
That 0.8 percentage point gain since 2019 is partly arithmetic. When the denominator shrinks (traditional schools losing students) while the numerator grows (charters adding them), share rises even without acceleration. But the charter sector did accelerate: it added 2,674 students during the two COVID years, then another 2,118 from 2021 to 2026, including 967 in 2024-25 alone.
The COVID fault line
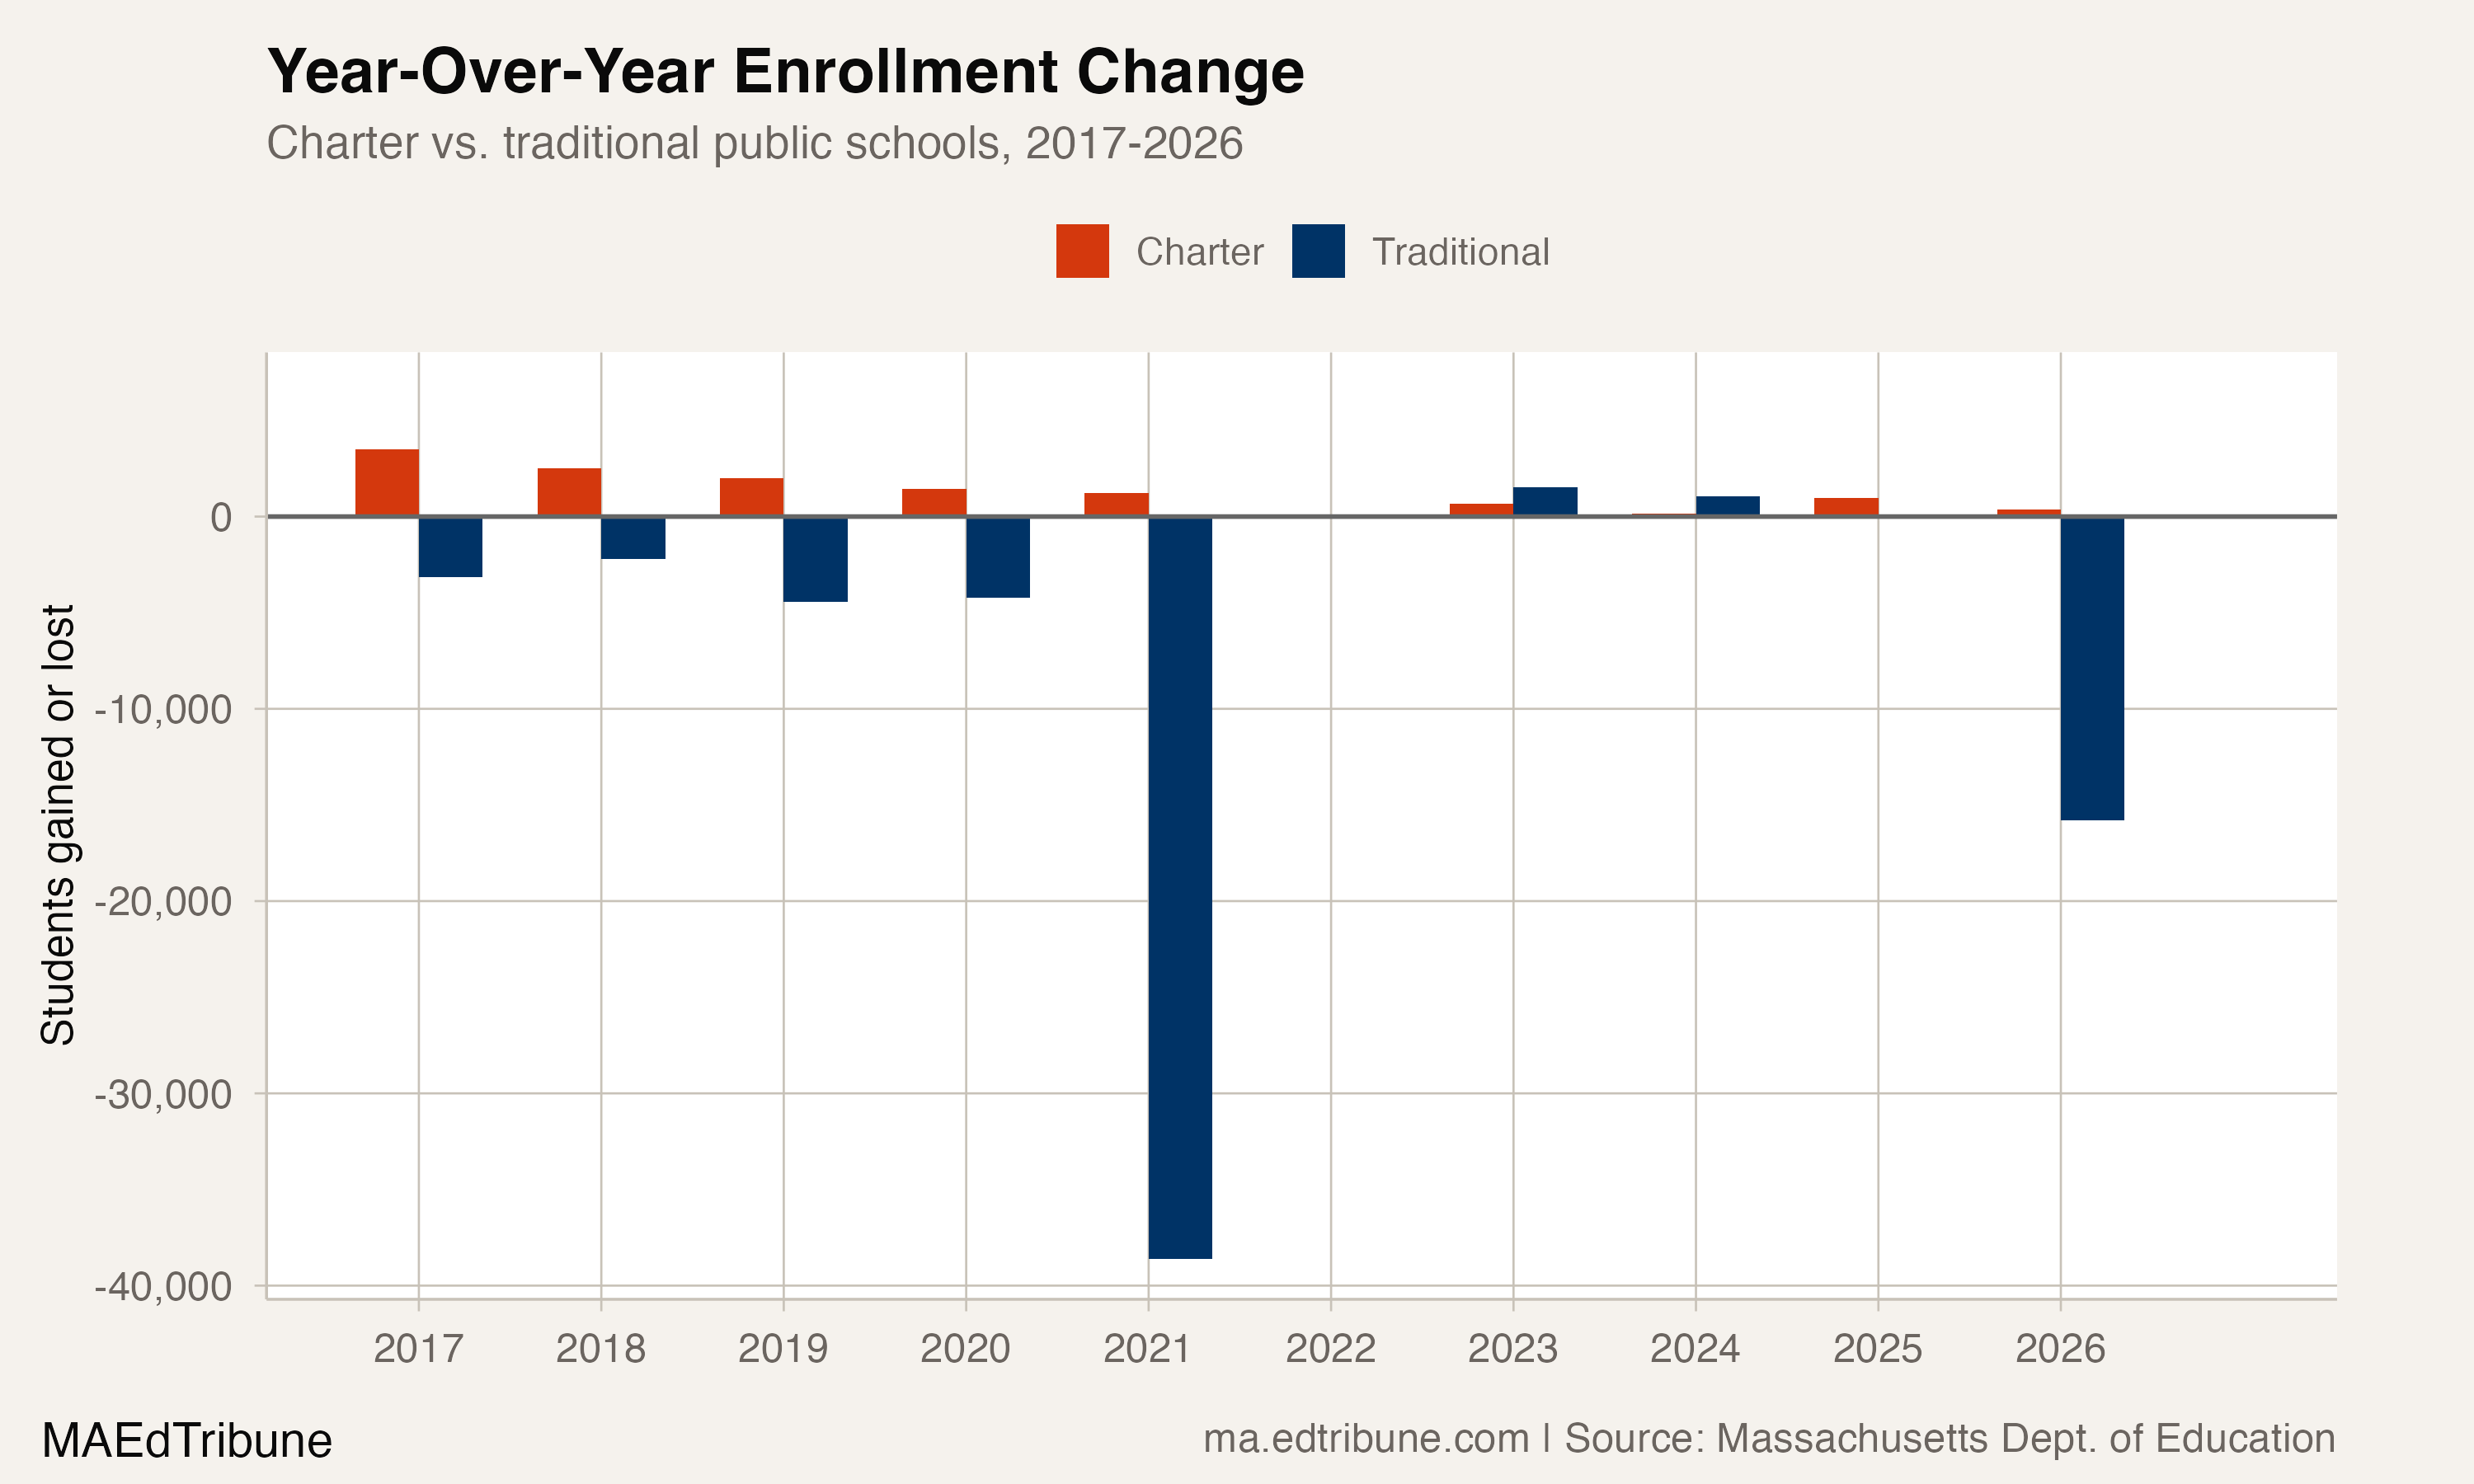
The year that cracked the system open was 2020-21. Traditional schools lost 38,608 students in a single year, the largest one-year drop in the dataset. Charter schools gained 1,245 that same year, on top of the 1,429 they added the year before.
The asymmetry is striking because charter schools were subject to the same pandemic restrictions as traditional districts. What they offered was something structural: smaller school communities, more direct communication with families, and, in many cases, faster adaptation to remote instruction. Stanford University's Center for Research on Education Outcomes (CREDO) has found that Massachusetts charter students gained approximately 41 additional days of learning in both reading and math compared to district school peers annually, according to the Massachusetts Charter Public School Association. That performance record likely gave families confidence to stay enrolled, or to join, even during the disruption.
Traditional schools partially stabilized from 2022 to 2025, clawing back 2,707 students over four years. Then 2025-26 erased it all: traditional enrollment dropped 15,800 in a single year, driven by falling immigration and the impact of federal enforcement actions on immigrant families. Chelsea↗ET Superintendent Almi Abeyta told WBUR she "never could have anticipated" losing 344 students, with families citing "cost of living and U.S. Immigration and Customs Enforcement agent sightings" as reasons for leaving.
Charter schools, meanwhile, added just 358 students in 2025-26, their smallest annual gain in a decade. Both sectors felt the demographic headwinds. The difference is that charters are still above their pre-pandemic baseline while traditional schools sit 55,933 students below theirs.
Who charter schools serve
The demographic composition of the charter sector complicates the narrative that charters are drawing affluent families away from traditional schools. In 2025-26, 39.7% of charter students are Hispanic and 28.3% are Black. Only 22.2% are white. The traditional sector is the inverse: 52.4% white, 25.4% Hispanic, 9.4% Black.
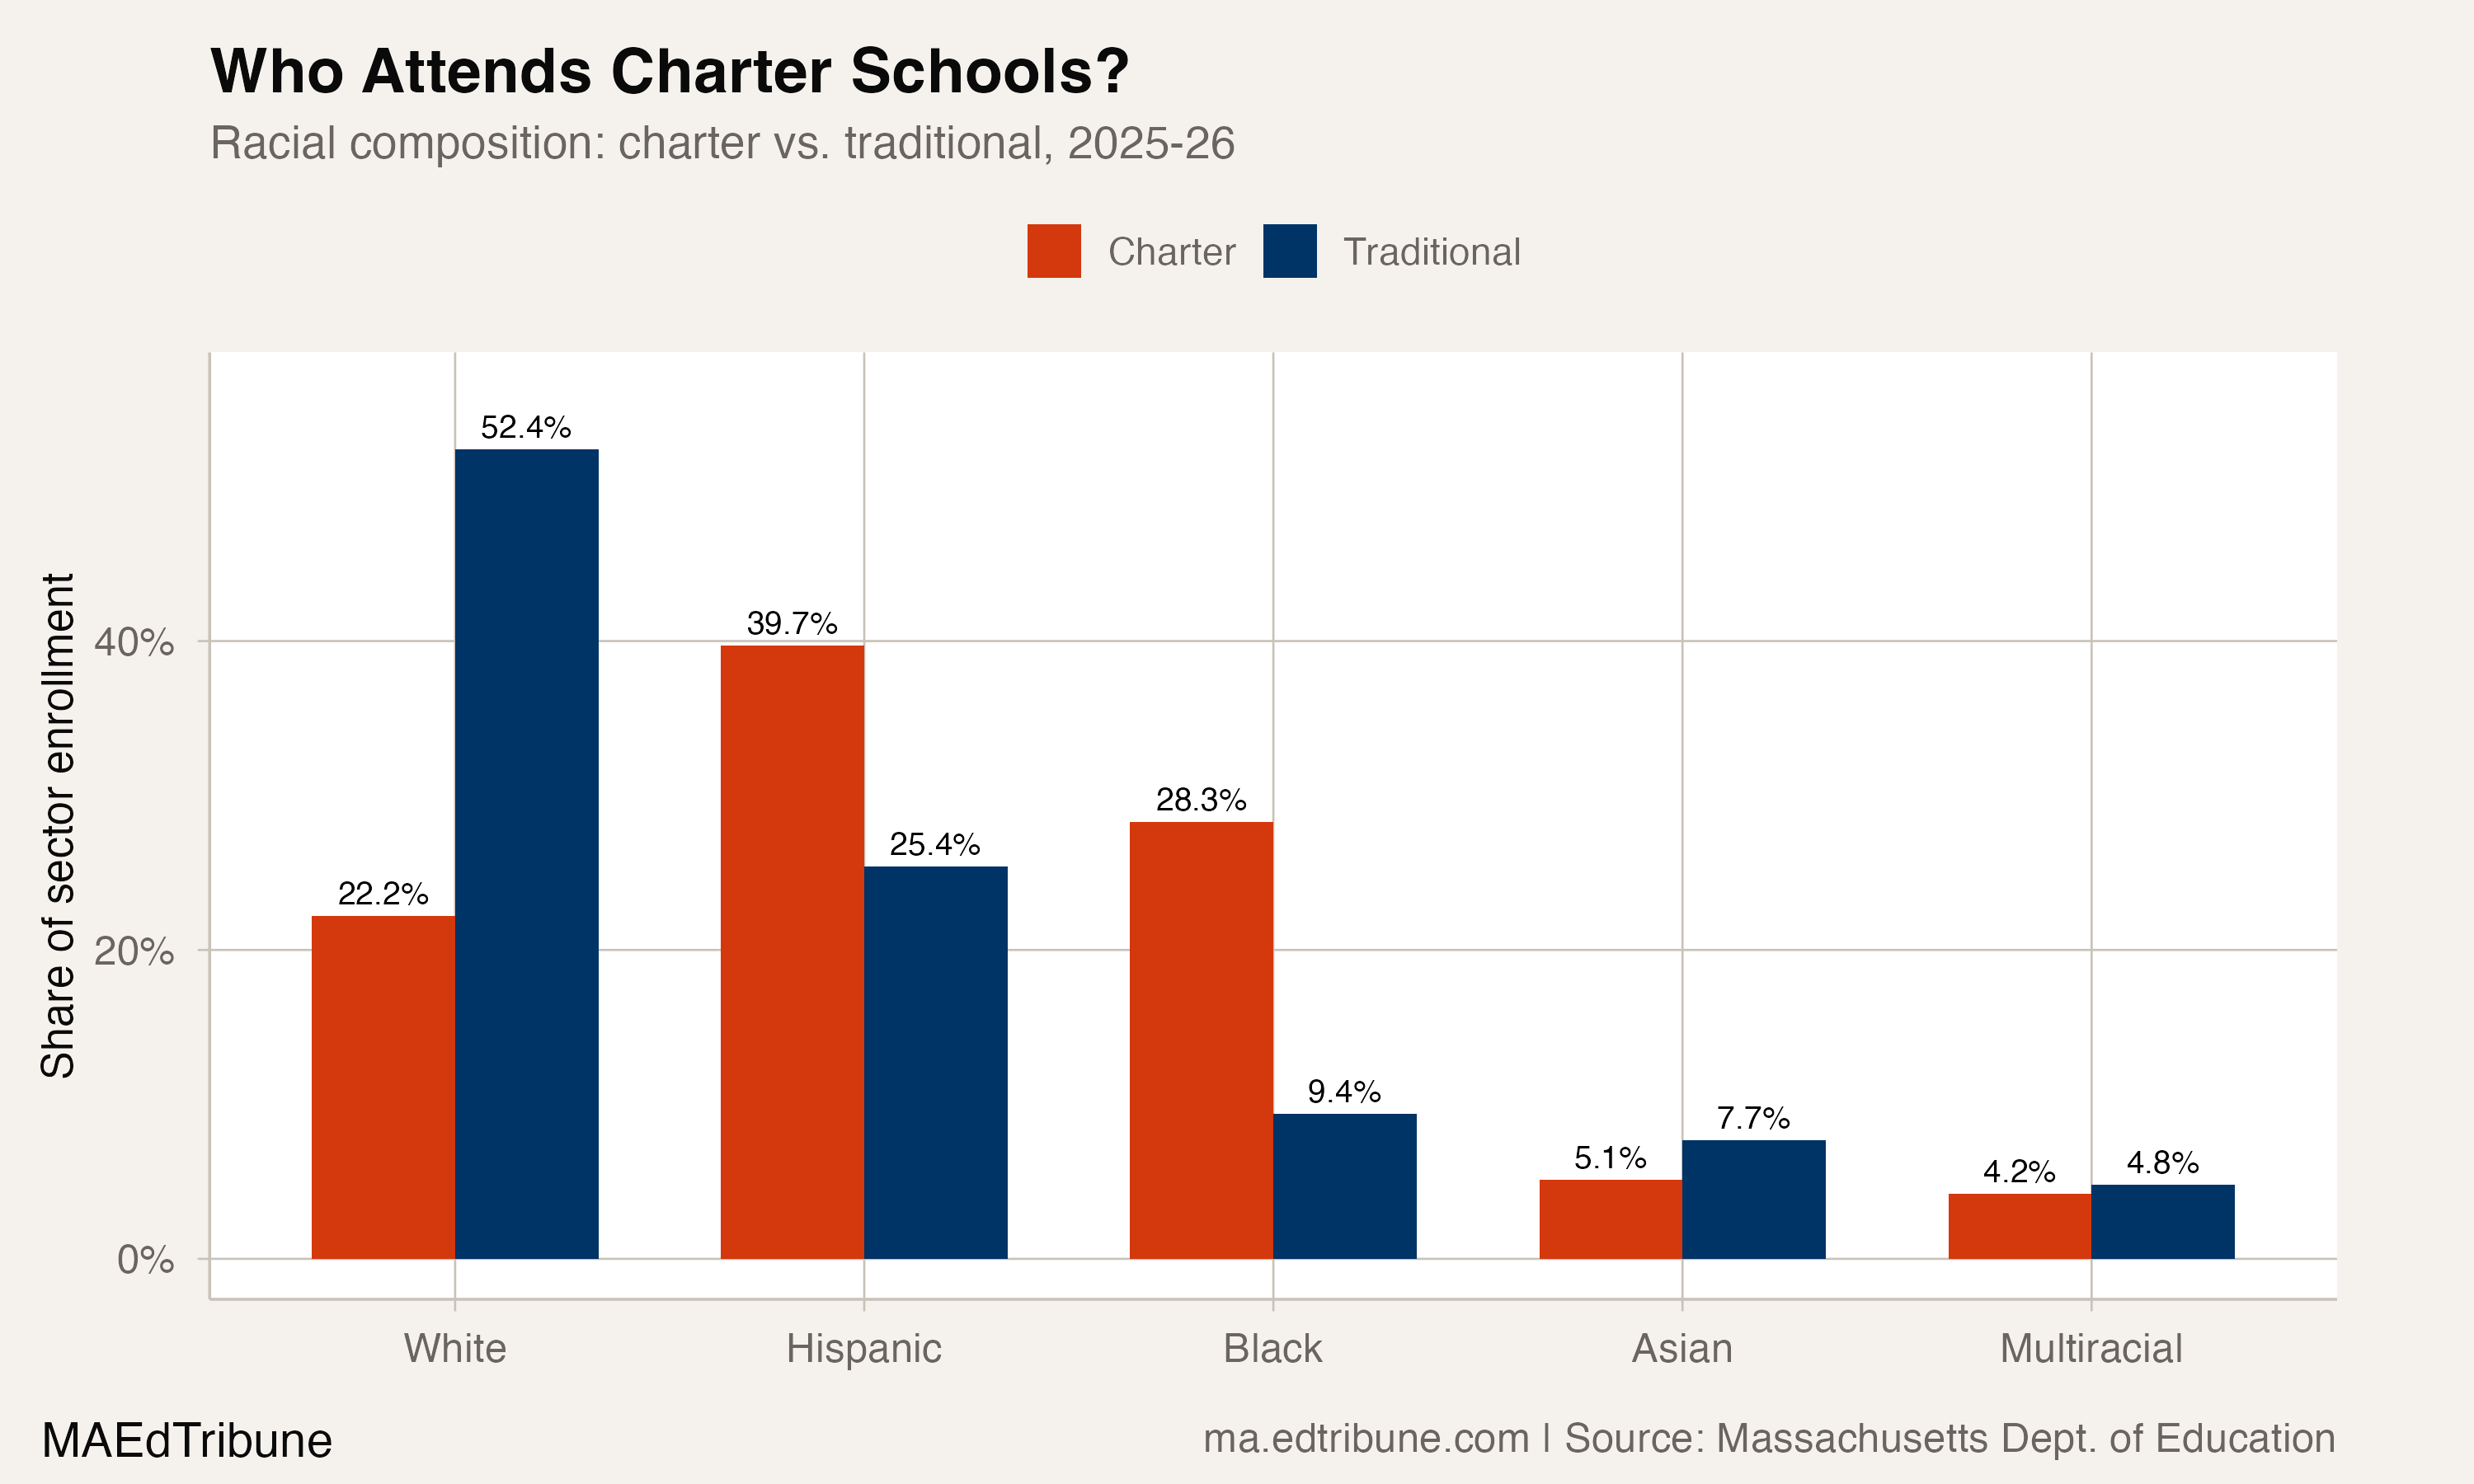
Charter schools in Massachusetts disproportionately serve students of color, particularly in urban Gateway Cities like Springfield↗ET, Lawrence↗ET, Lynn↗ET, and Boston↗ET. Brookings Institution research has found that the charter cap particularly constrains expansion in these communities, where demand is highest and where charter school academic effects are largest: Boston charter middle school students show math gains of roughly 25% of a standard deviation annually, with effects "particularly large for disadvantaged students, English learners, special education students."
The cap, supported by voters worried about the fiscal impact on traditional districts, most directly limits options for low-income Black and Hispanic families in the cities where charters are clustered.
Winners and losers within the sector
Not every charter school grew. The sector's 4,792-student net gain since 2019 masks considerable internal churn. Community Day Charter Public School - Prospect added 799 students, a 200% increase. Alma del Mar Charter School in New Bedford↗ET grew by 603 students, more than doubling its enrollment. Hampden Charter School of Science East, Benjamin Franklin Classical Charter Public, and Veritas Preparatory each added over 400.
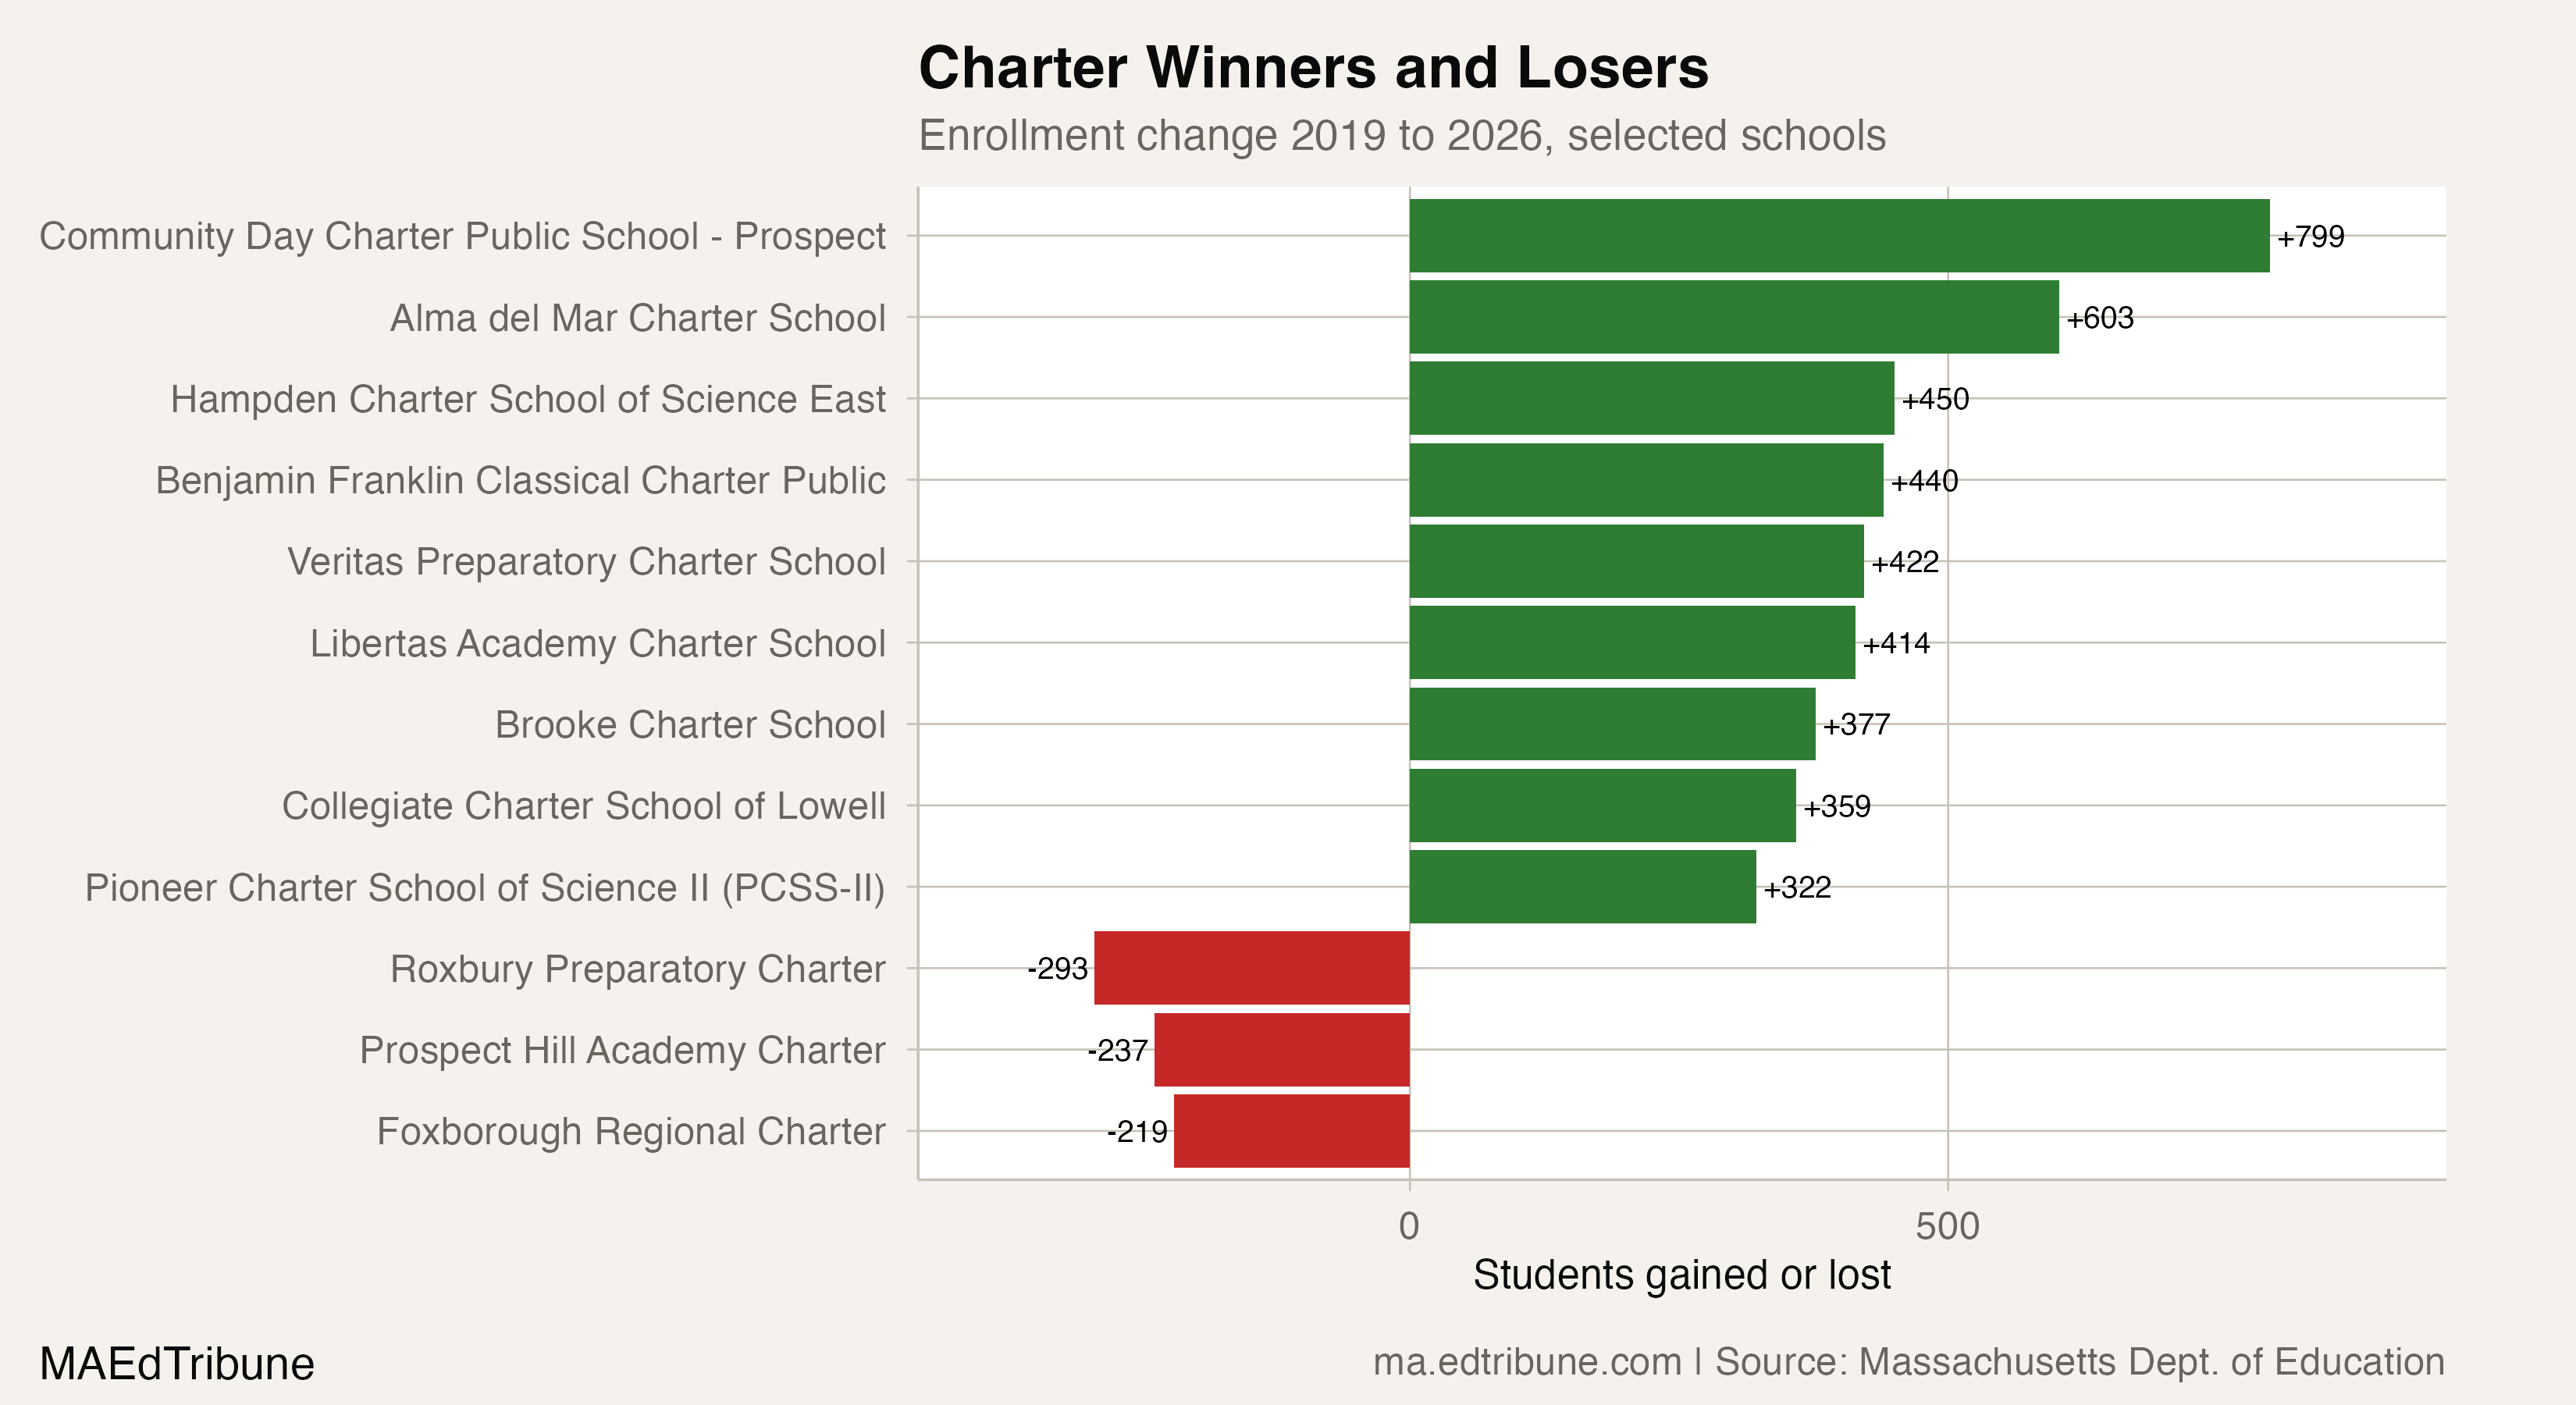
On the other side, Roxbury Preparatory Charter lost 293 students, a 19.3% decline. Prospect Hill Academy Charter fell by 237 students (21.1%), and Foxborough Regional Charter dropped 219 (13.4%). Some of these losses reflect the same demographic pressures hitting traditional schools in the same neighborhoods.
20,900 on the outside
The most telling number in the charter story is not enrollment. It is the waitlist. As of March 2025, 64 of 72 charter schools reported waitlists totaling 32,024 entries, representing 20,900 unique students. Brooke Charter School alone had 3,016 applications for a school that enrolls 2,230.
Those 20,900 students represent unmet demand that the cap prevents from being filled. Whether the cap is good policy is a separate question from whether the demand is real. It is. The 2024-25 waitlist showed 21,120 unique students, essentially flat year over year, even as the state's overall enrollment fell.
What the traditional sector faces
The 245 traditional districts that lost enrollment between 2019 and 2026, out of 322 total, are not losing students primarily to charters. Charter enrollment grew by 4,792 over that period. Traditional enrollment fell by 55,933. The charter sector could not have absorbed that loss even if every waitlisted student had been admitted. The bulk of the decline reflects lower birth rates, outmigration from the state, shifting enrollment to private schools, and, most recently, the impact of federal immigration enforcement on immigrant families.
Boston alone accounts for 7,017 of the traditional sector's losses, a 13.6% decline that has prompted plans to close 14 school buildings by 2030. Only 77 of 322 traditional districts have recovered to their 2019 enrollment levels.
The charter divergence matters not because it caused the traditional sector's decline, but because it reveals something about the nature of that decline. Families with the strongest demand for alternatives found ways to access them. Families without options, in communities where the cap prevents new charters from opening, did not.
Meanwhile, 20,900 students sit on waitlists. Brooke Charter has 3,016 applications for 2,230 seats. Whatever Massachusetts decides about the cap, those families have already made their choice.
Detailed code that reproduces the analysis and figures in this article is available exclusively to EdTribune subscribers.
Discussion
Sign in to join the discussion.
Loading comments...