In this series: Massachusetts 2025-26 Enrollment.
In 2025, Boston↗ET Public Schools gained 352 students. It was the district's first year of growth since 2015, a small green bar in a decade of red. Superintendent Mary Skipper had reason to believe the worst might be behind her.
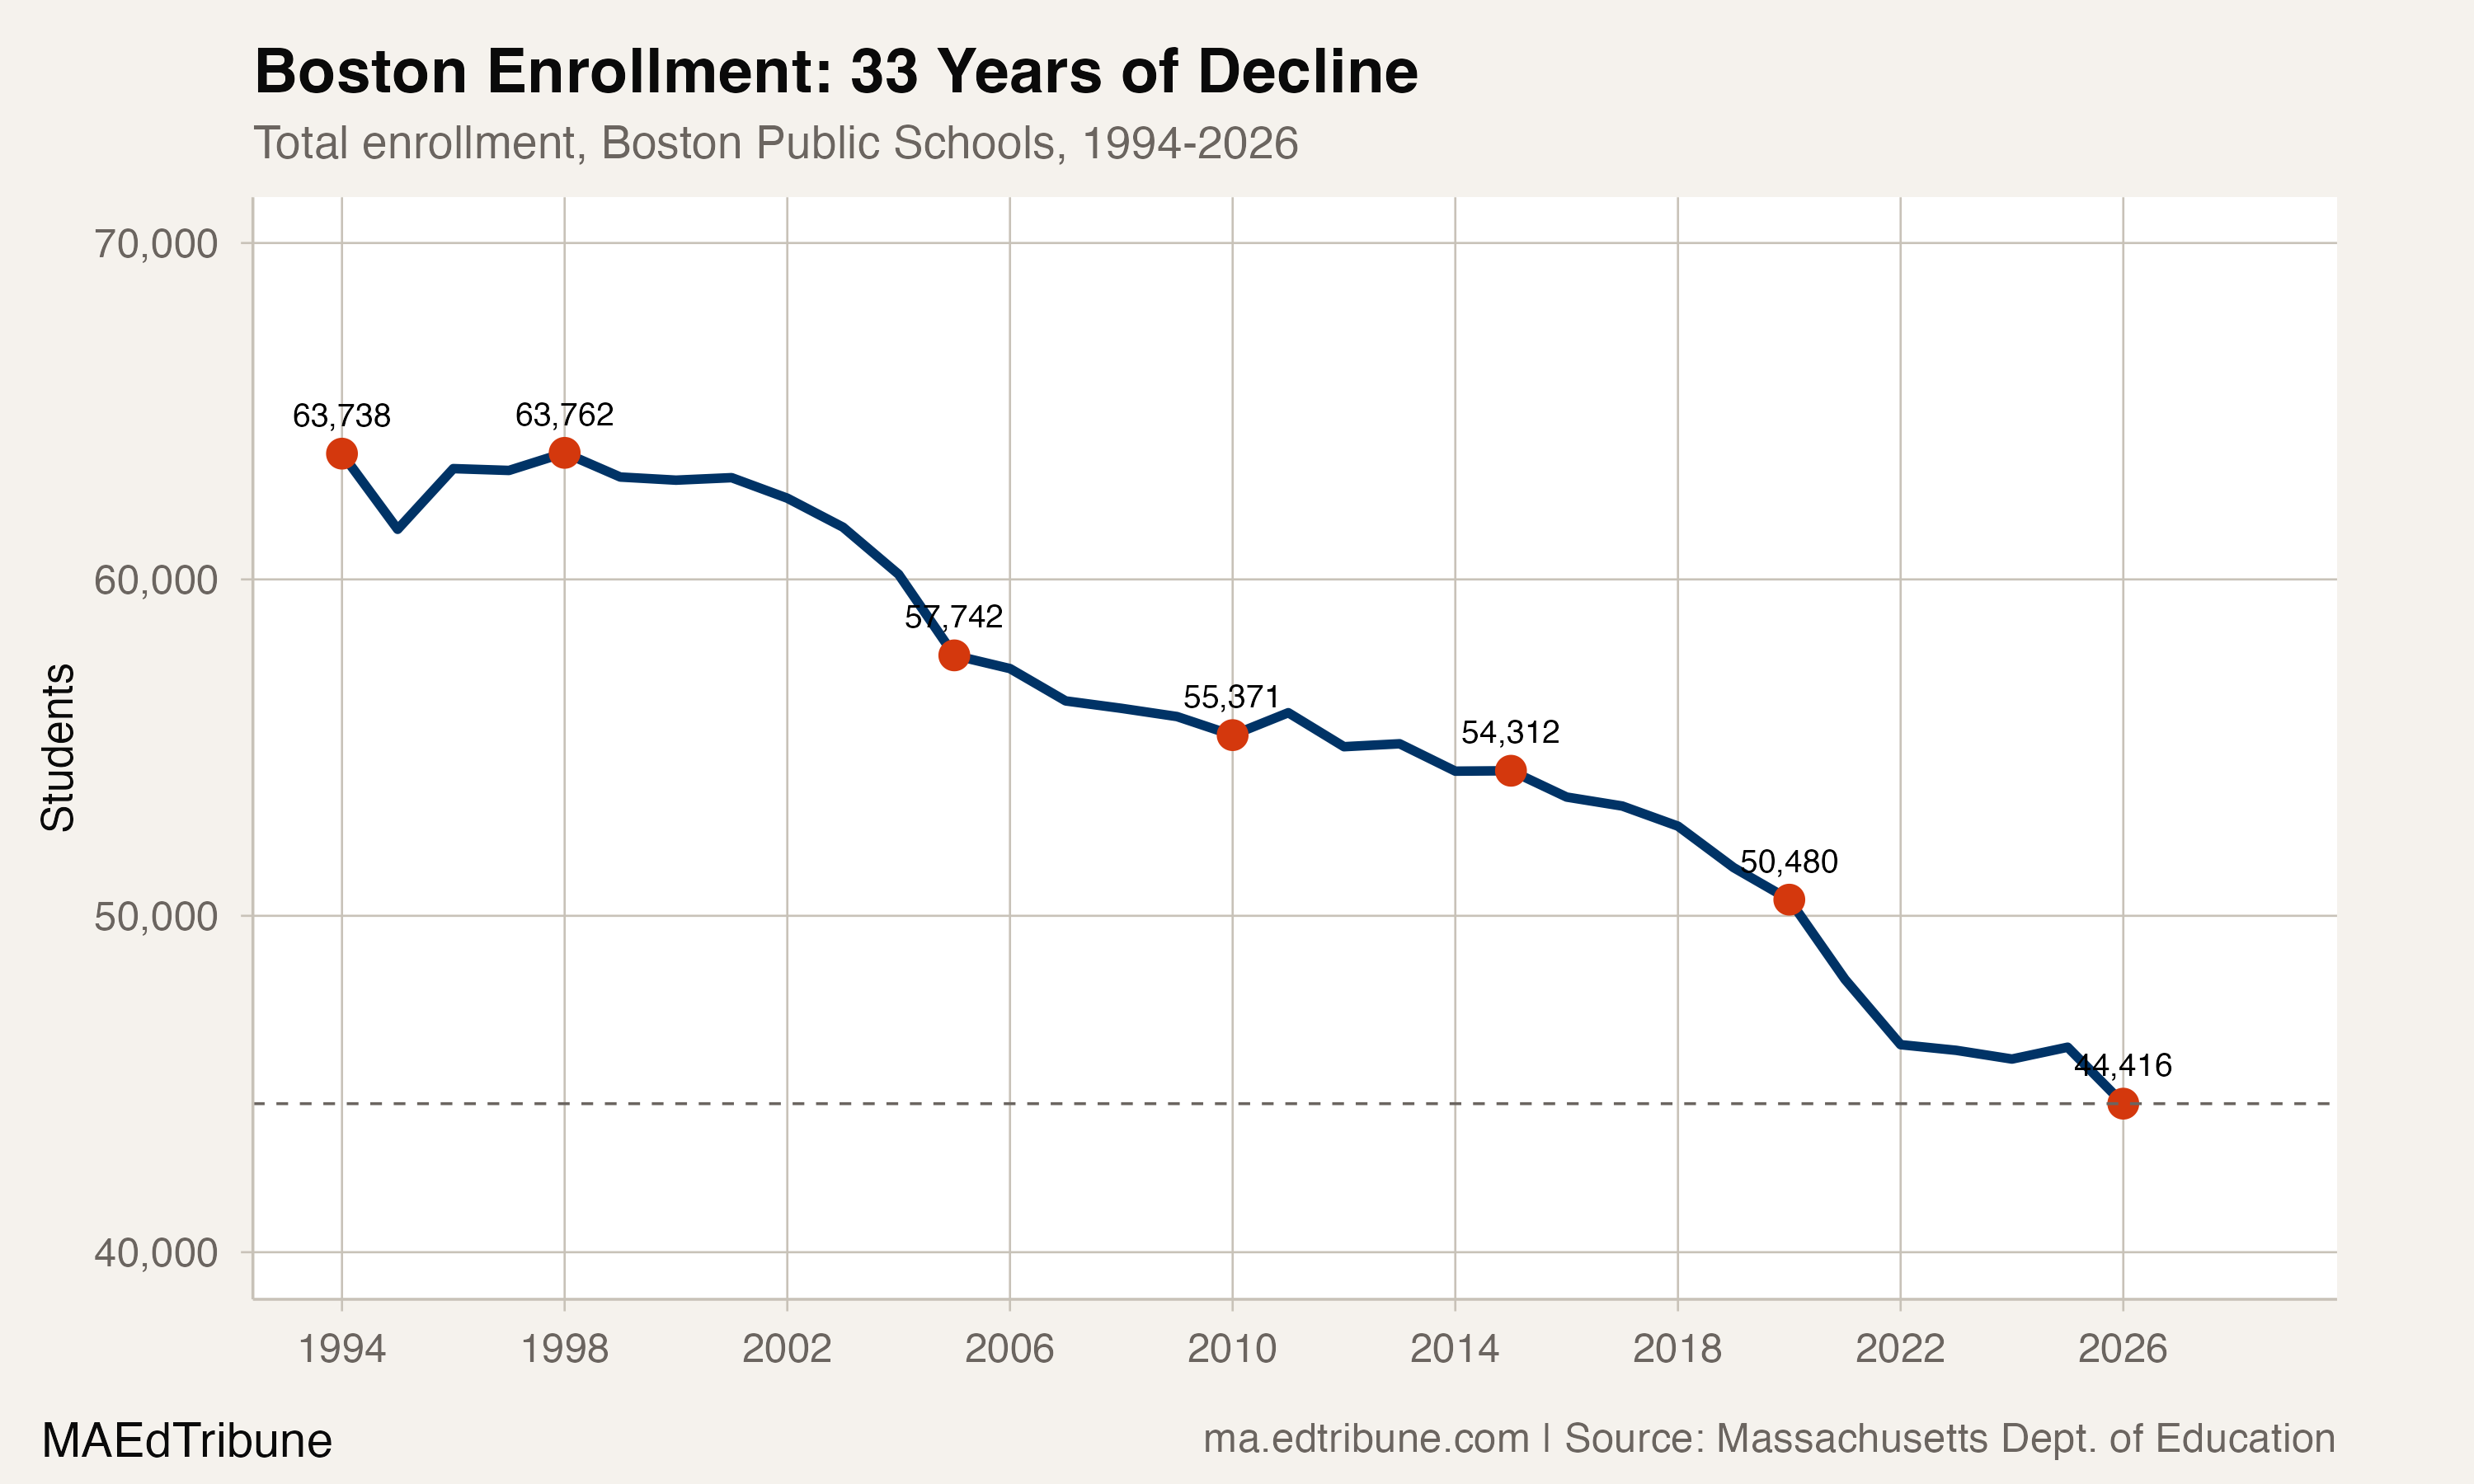
Then 2026 arrived: 1,678 students gone. Not a slow bleed but a sudden rupture, erasing the prior year's gain nearly five times over and dropping BPS to 44,416 students, an all-time low in 33 years of state records. The district that educated 63,762 students at its 1998 peak has now lost 19,346 of them, a 30.3% decline across 28 years.
The longest unbroken pattern in Massachusetts
Boston has declined in 25 of 32 year-over-year transitions since 1994. No other large district in the state comes close to that record of sustained loss. The decline has come in waves, each with its own character.
From 1998 to 2005, the district shed 6,020 students (9.4%), a period of rapid loss driven by demographic shifts in the city's school-age population. The bleeding slowed between 2005 and 2010, with 2,371 students lost (4.1%). Then a grinding nine-year slide from 2010 through 2019 took another 3,938 (7.1%), interrupted only by a brief uptick in 2011.
COVID accelerated everything. The district lost 2,368 students in a single year between 2020 and 2021, a 4.7% drop. Since 2021, another 3,696 have left — a further 7.7% decline from the pandemic trough.

Nobody else is falling this fast
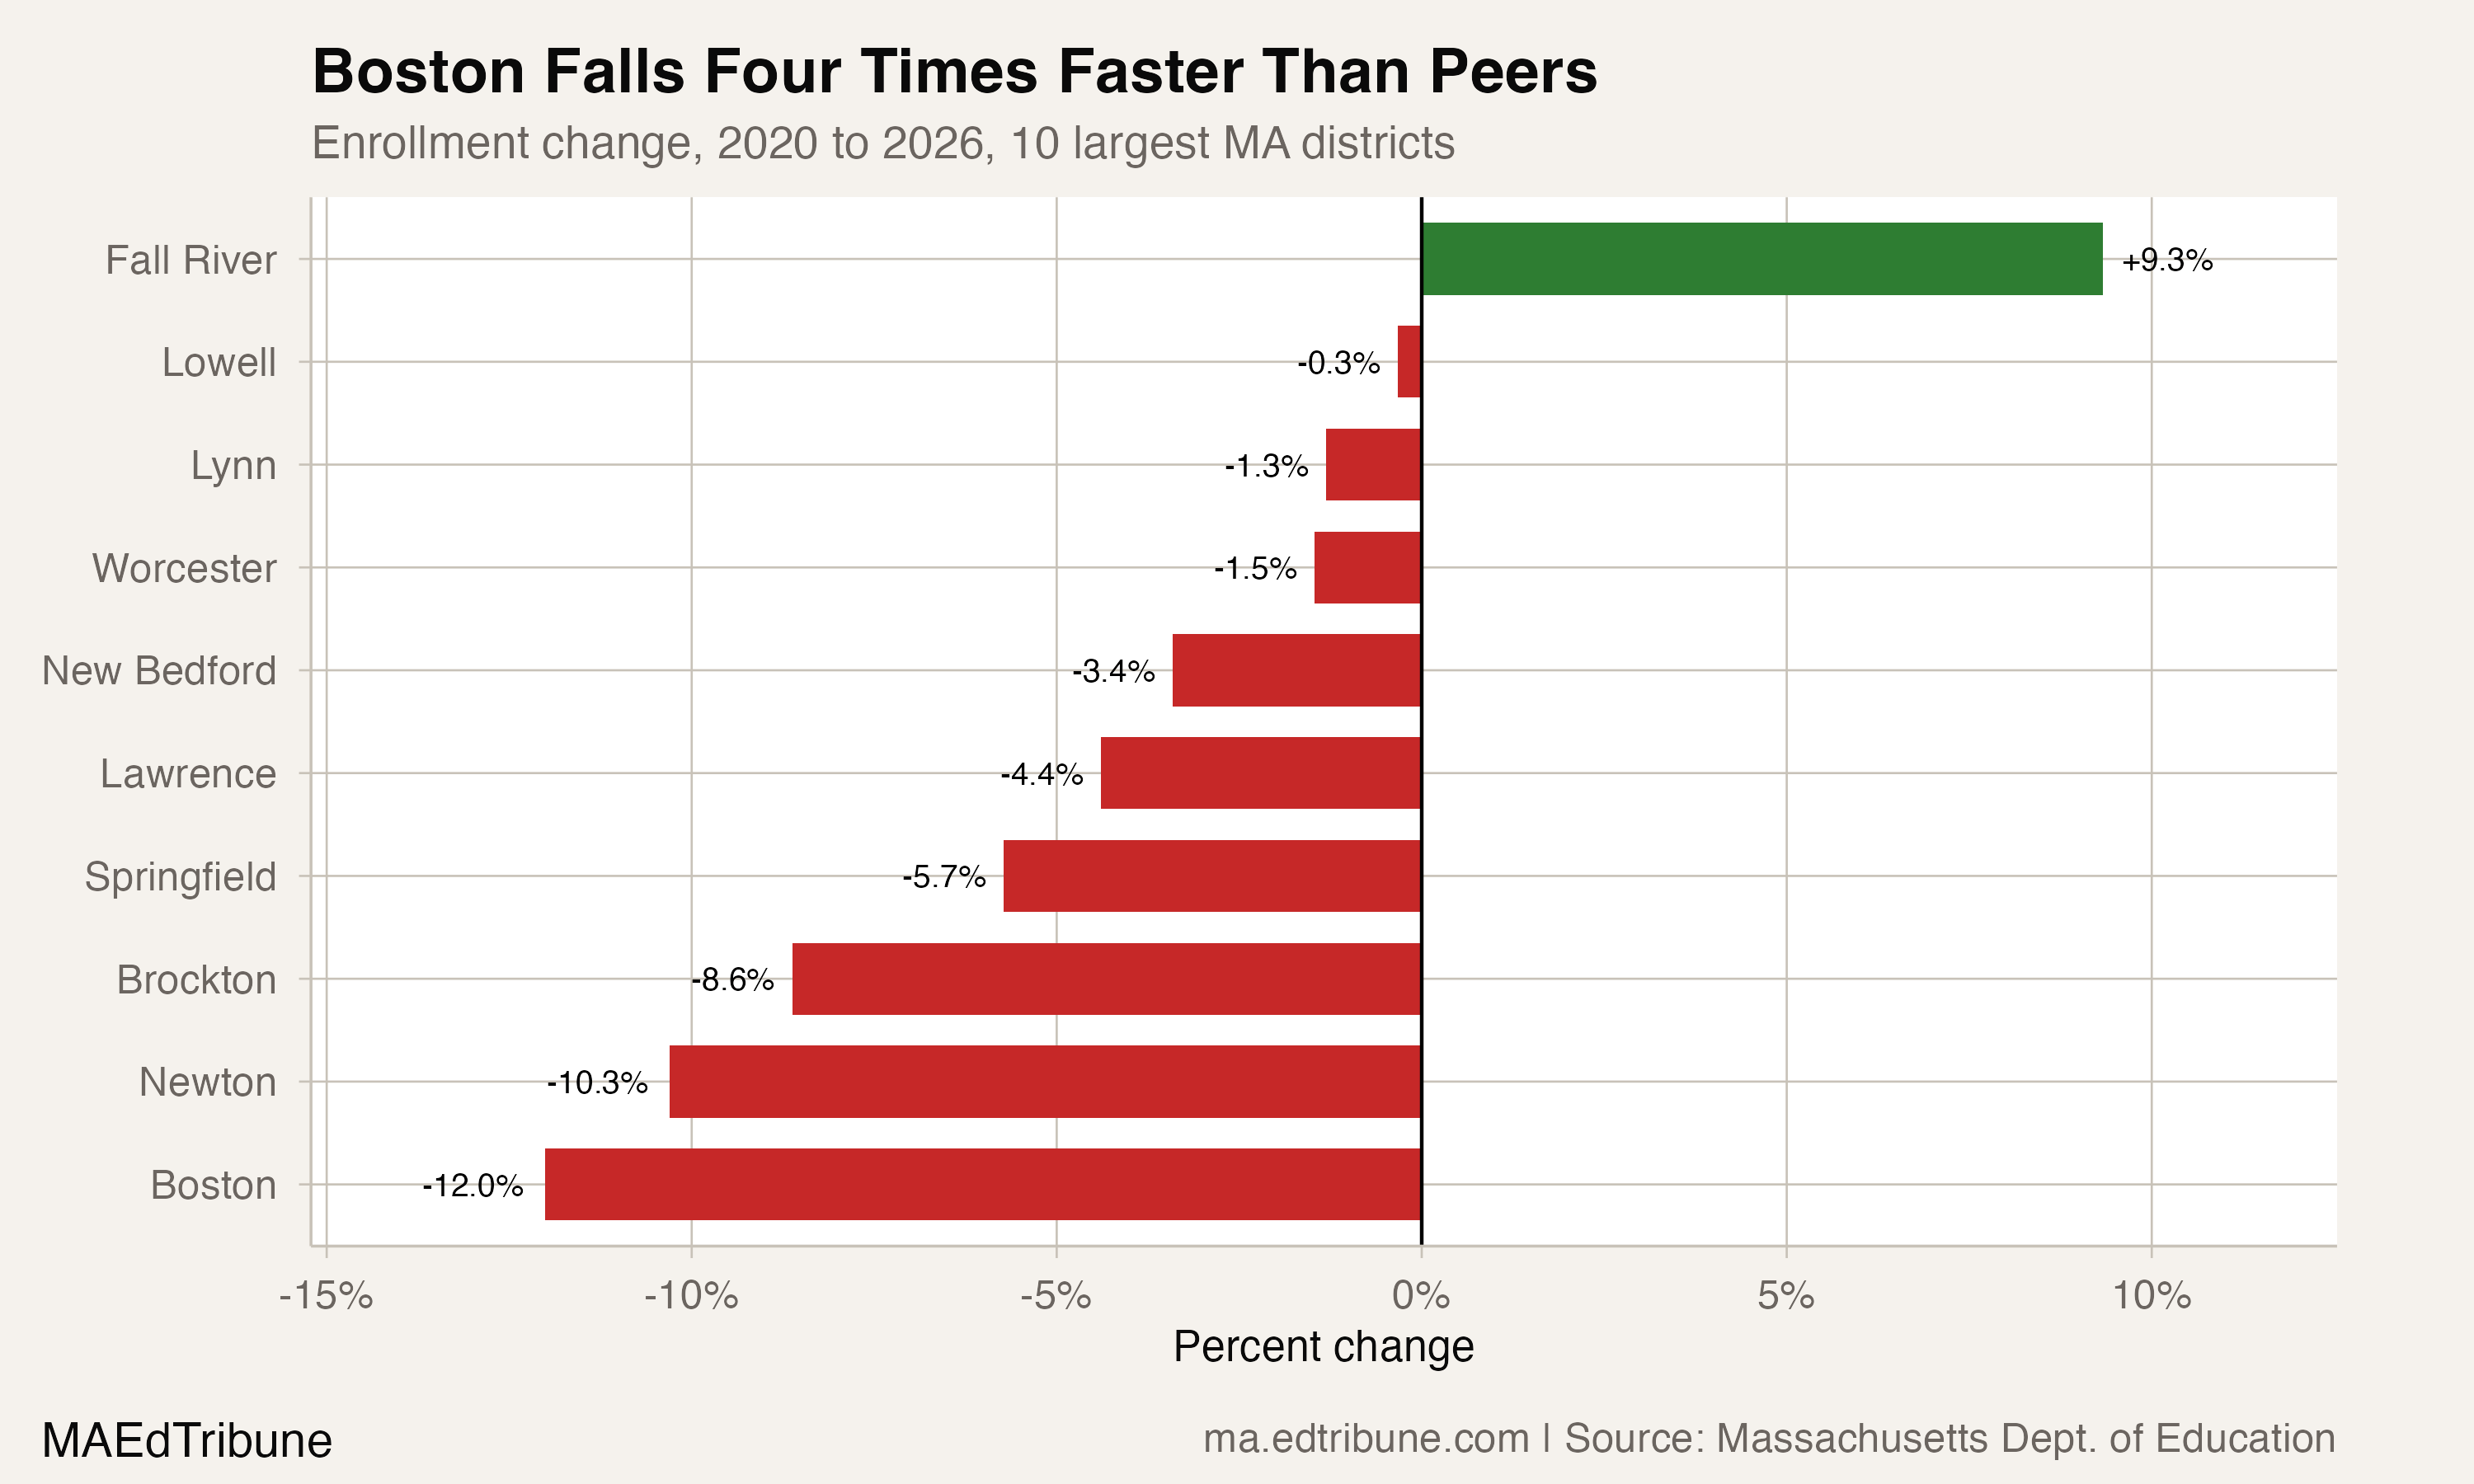
Among Massachusetts' 10 largest districts, Boston's 12.0% decline since 2020 is four times the peer average of 2.9%. Newton↗ET, the next-steepest loser, fell 10.3%. Worcester↗ET and Lowell↗ET, which serve comparable student populations, lost just 1.5% and 0.3% respectively. Fall River↗ET actually grew by 9.3%.
The gap is striking because Boston is not a district in financial distress or rural depopulation. It operates in the state's most expensive housing market, a city that has added residents even as it has shed students. Between 1980 and 2020, Boston's overall population grew by more than 80,000 people, according to Boston Indicators. Its school-age population moved in the opposite direction, falling by nearly 28,000 over the same period.
What a $162,000 income requirement does to a school district
The most direct mechanism is cost. The 2025 Greater Boston Housing Report Card found that a household now needs an income of over $162,000 to afford an entry-level home mortgage, up from $98,000 in 2021. Building permits in Greater Boston fell from 15,019 in 2021 to under 9,000 in 2024. Young families, the demographic that feeds kindergarten pipelines, are priced out before they arrive.
Boston's birth rate compounds the pressure. Annual births in the city fell from 7,728 in 2017 to 6,788 in 2021, a 12% decline in four years, with sharper drops among Asian (24.0%), Black (17.1%), and Latino (16.4%) residents. Those fewer babies are now the kindergarten classes that aren't filling seats.
The pipeline numbers confirm it. In 1998, Boston enrolled 5,060 kindergartners and 3,675 twelfth-graders, a healthy ratio of 138 incoming students for every 100 graduates. By 2026, that ratio inverted: 3,248 kindergartners against 3,677 seniors, meaning the district is now graduating more students than it is enrolling for the first time in its recorded history.
The immigration factor
The 2026 plunge has a specific accelerant. Of the 1,678 students Boston lost in 2025-26, approximately 1,060 were English learners, according to WBUR. That represents 63% of the total loss coming from a single population.
The timing aligns with the Trump administration's escalation of immigration enforcement beginning in January 2025. Districts with large immigrant populations across eastern Massachusetts saw the steepest drops: Chelsea↗ET lost nearly 6%, and Boston, Framingham↗ET, Brockton↗ET, and Revere↗ET all reported outsized English learner declines.
"They want to be in states where there's less attention, in terms of less presence of ICE." -- WBUR, January 2026
Boston's English learner enrollment had been growing steadily for years, from 9,789 in 2005 (17.0% of the district) to a peak of 16,920 in 2013 (30.7%). That growth partially offset losses in other populations. The 2026 reversal, from 15,972 to 14,913, is the steepest non-pandemic drop in English learners since 2005. (The COVID year of 2021 saw a larger decline of 2,320.) It removes the one demographic buffer that had been slowing the district's decline.
A district that costs more as it shrinks
Boston's shrinking enrollment does not produce proportional savings. Superintendent Skipper's proposed FY27 budget totals $1.71 billion, a 4.5% increase over the current year, even as the district projects 3,000 fewer students over two years. Per-pupil costs now exceed $31,000, among the highest of any large urban district in the country.
"The reality is that our costs are increasing at a faster rate than our revenues." -- Superintendent Mary Skipper, WBUR, February 2026
The district faces an $86 million cost increase next year across health insurance, transportation, out-of-district special education, and labor contracts. To close the gap, BPS has proposed cutting 300 to 400 positions, including more than 200 teachers and 100 paraprofessionals. Three schools are set to close by summer 2027, affecting roughly 800 students, with the district aiming to reduce its 109-school footprint to 95 by 2030.
The fiscal math is relentless. Nearly one in four Boston students (24.4%) receives special education services, and one in three (33.6%) is classified as an English learner. The instructional programs these students receive carry higher per-pupil costs than general education, and those costs do not decline when a general-education student leaves the district.
The charter question
About 9,700 students attend Boston-authorized charter schools that are counted separately from BPS enrollment. Brooke Charter (2,230 students) and Roxbury Prep (1,225) are the largest. These students live in Boston but do not appear in the district's 44,416 headcount.
Charter enrollment is a contributing factor but not the primary driver of the long-term trend. Boston's decline predates the significant expansion of the charter sector, and the magnitude of the 19,346-student loss since 1998 far exceeds current charter enrollment. The housing affordability crisis, falling birth rates, and immigration enforcement are all more recent forces layered onto a structural demographic shift that has been underway for a generation.
A shrinking footprint in a state that isn't growing either
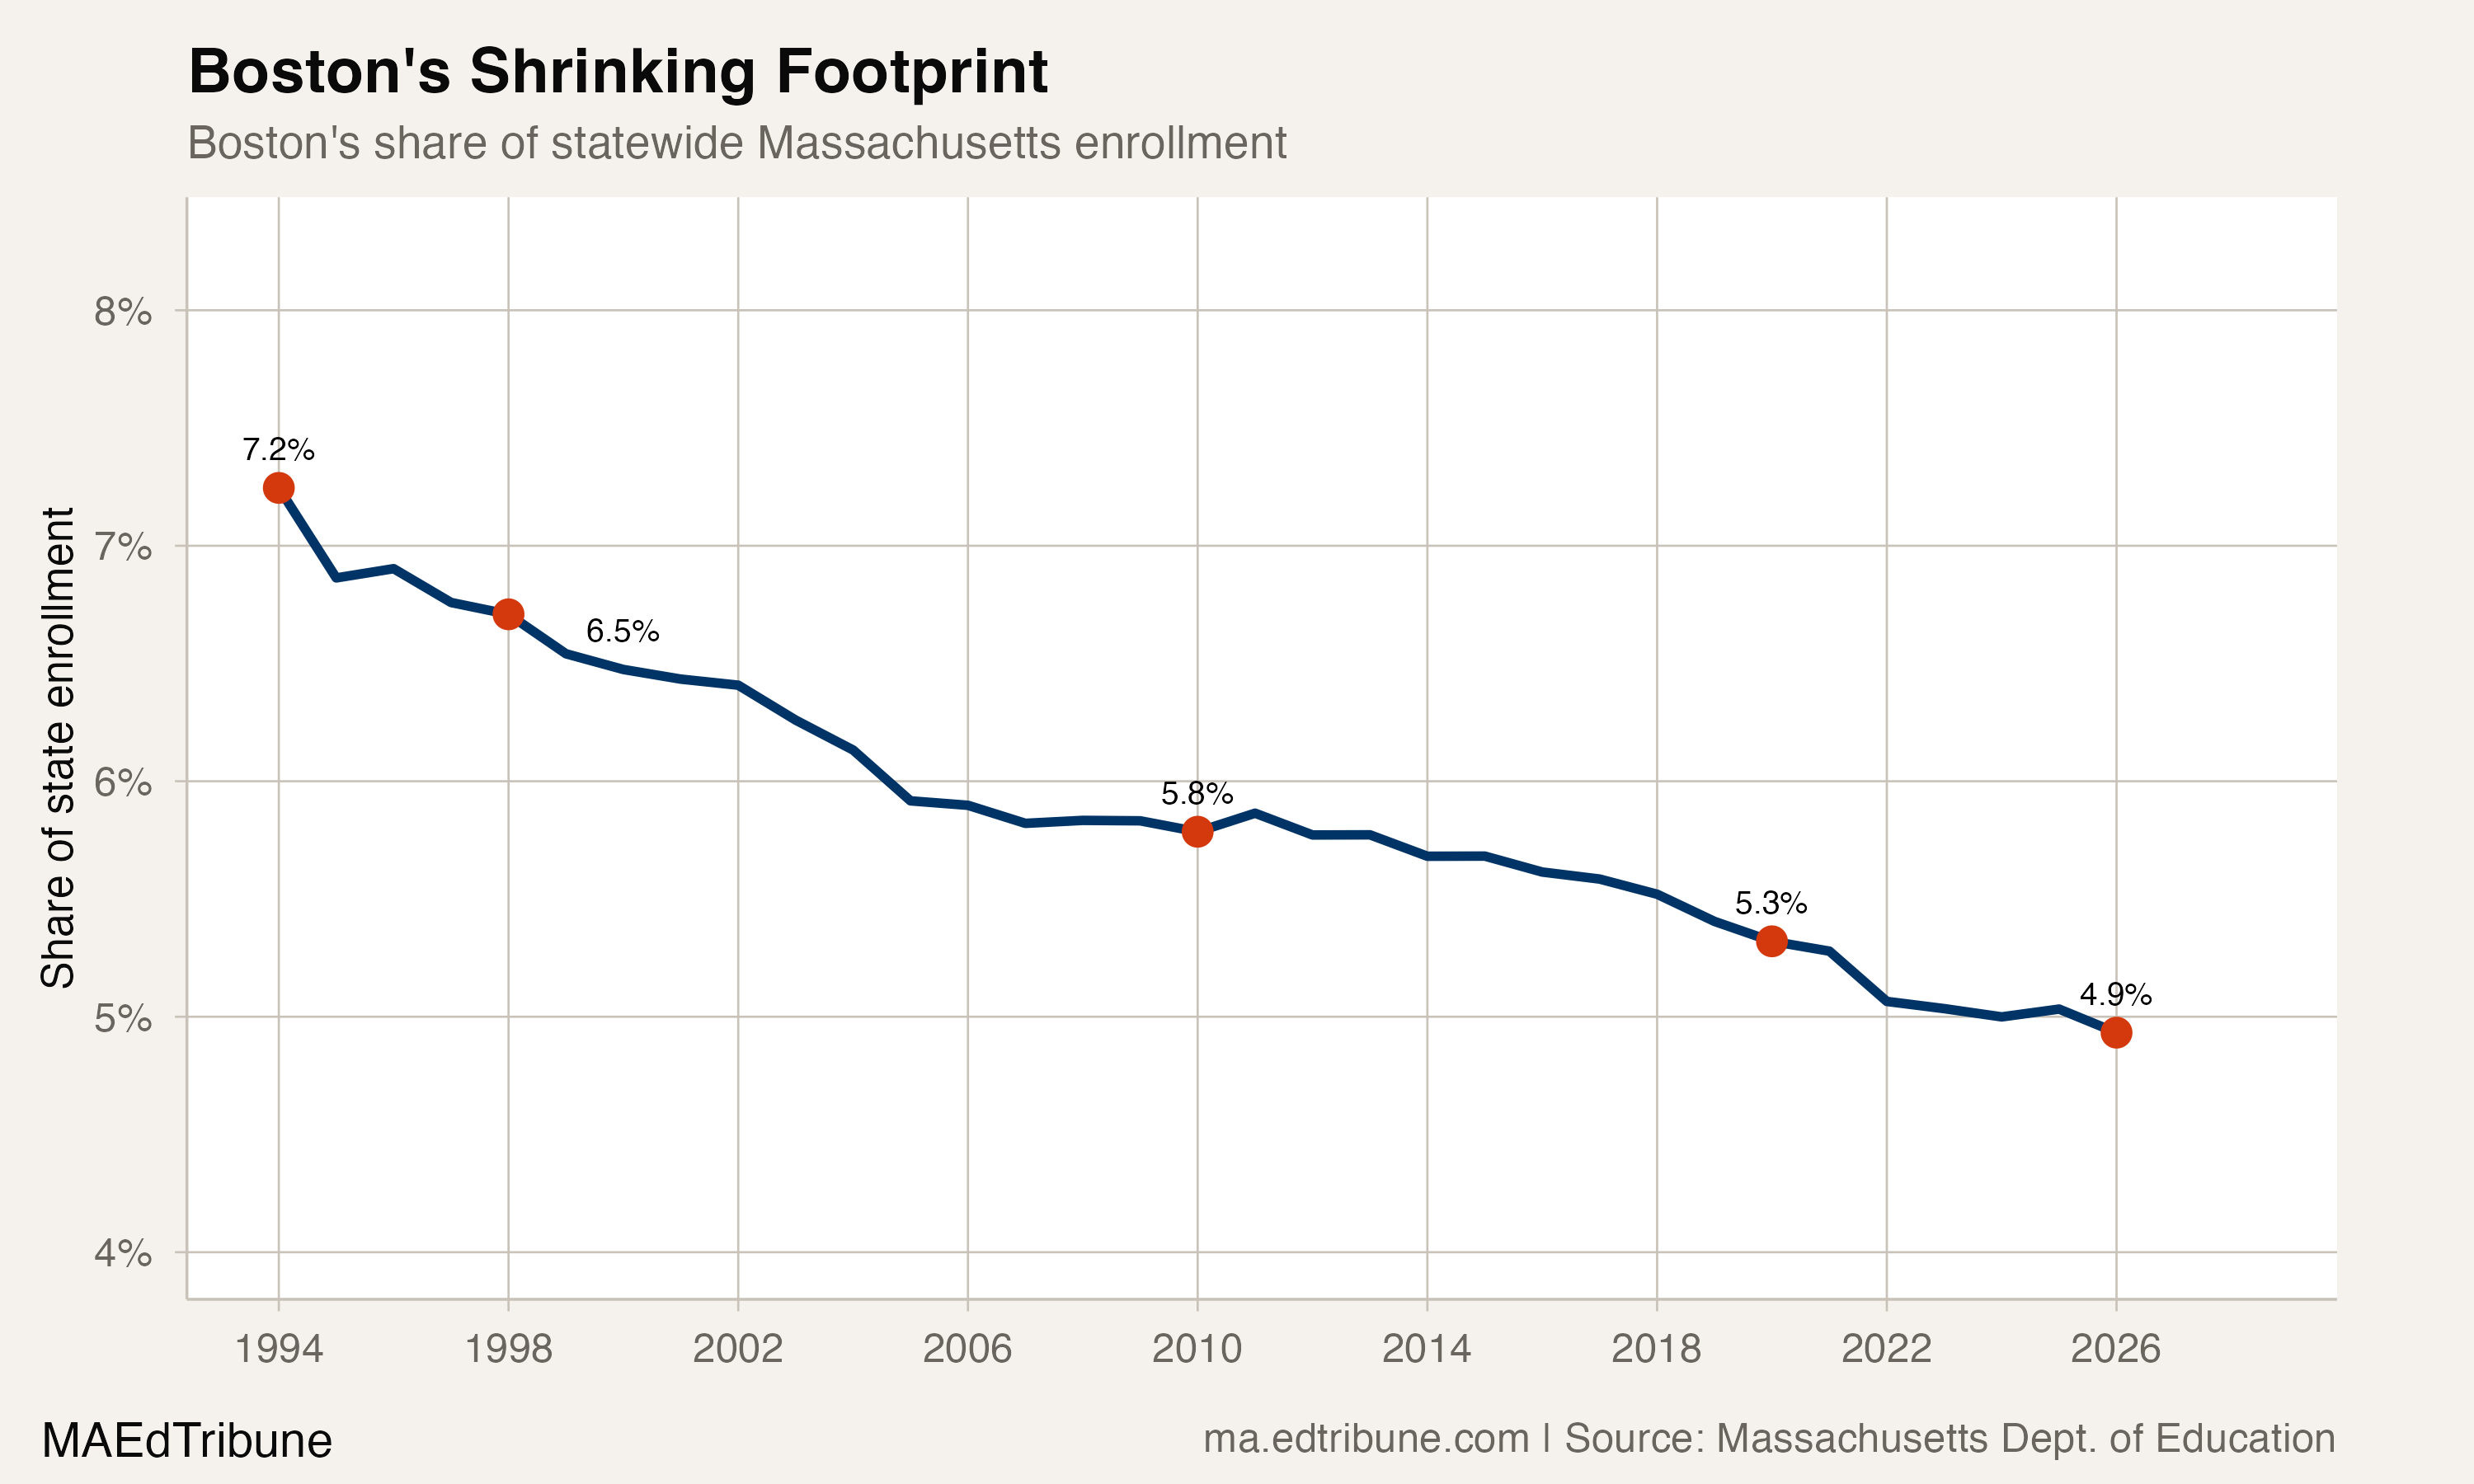
Boston's share of statewide enrollment has fallen from 7.2% in 1994 to 4.9% in 2026. The district is declining faster than the state as a whole. Massachusetts statewide enrollment dropped to 900,490 in 2026, its lowest since 1994, but Boston's 30.3% decline since its peak dwarfs the state's 8.4% drop from its own 2003 peak of 983,313.
Superintendent Skipper's plan calls for 95 school buildings by 2030, down from 109 in January 2026. That means closing or merging 14 more schools in four years while simultaneously managing a budget that rises 4.5% annually and an enrollment that falls 3% to 4%. Somewhere in the district, a kindergarten classroom enrolled 3,248 five-year-olds in fall 2025. In 1998, that number was 5,060. The buildings those children sit in were designed for a city that no longer exists.
Detailed code that reproduces the analysis and figures in this article is available exclusively to EdTribune subscribers.
Discussion
Sign in to join the discussion.
Loading comments...