In this series: Massachusetts 2025-26 Enrollment.
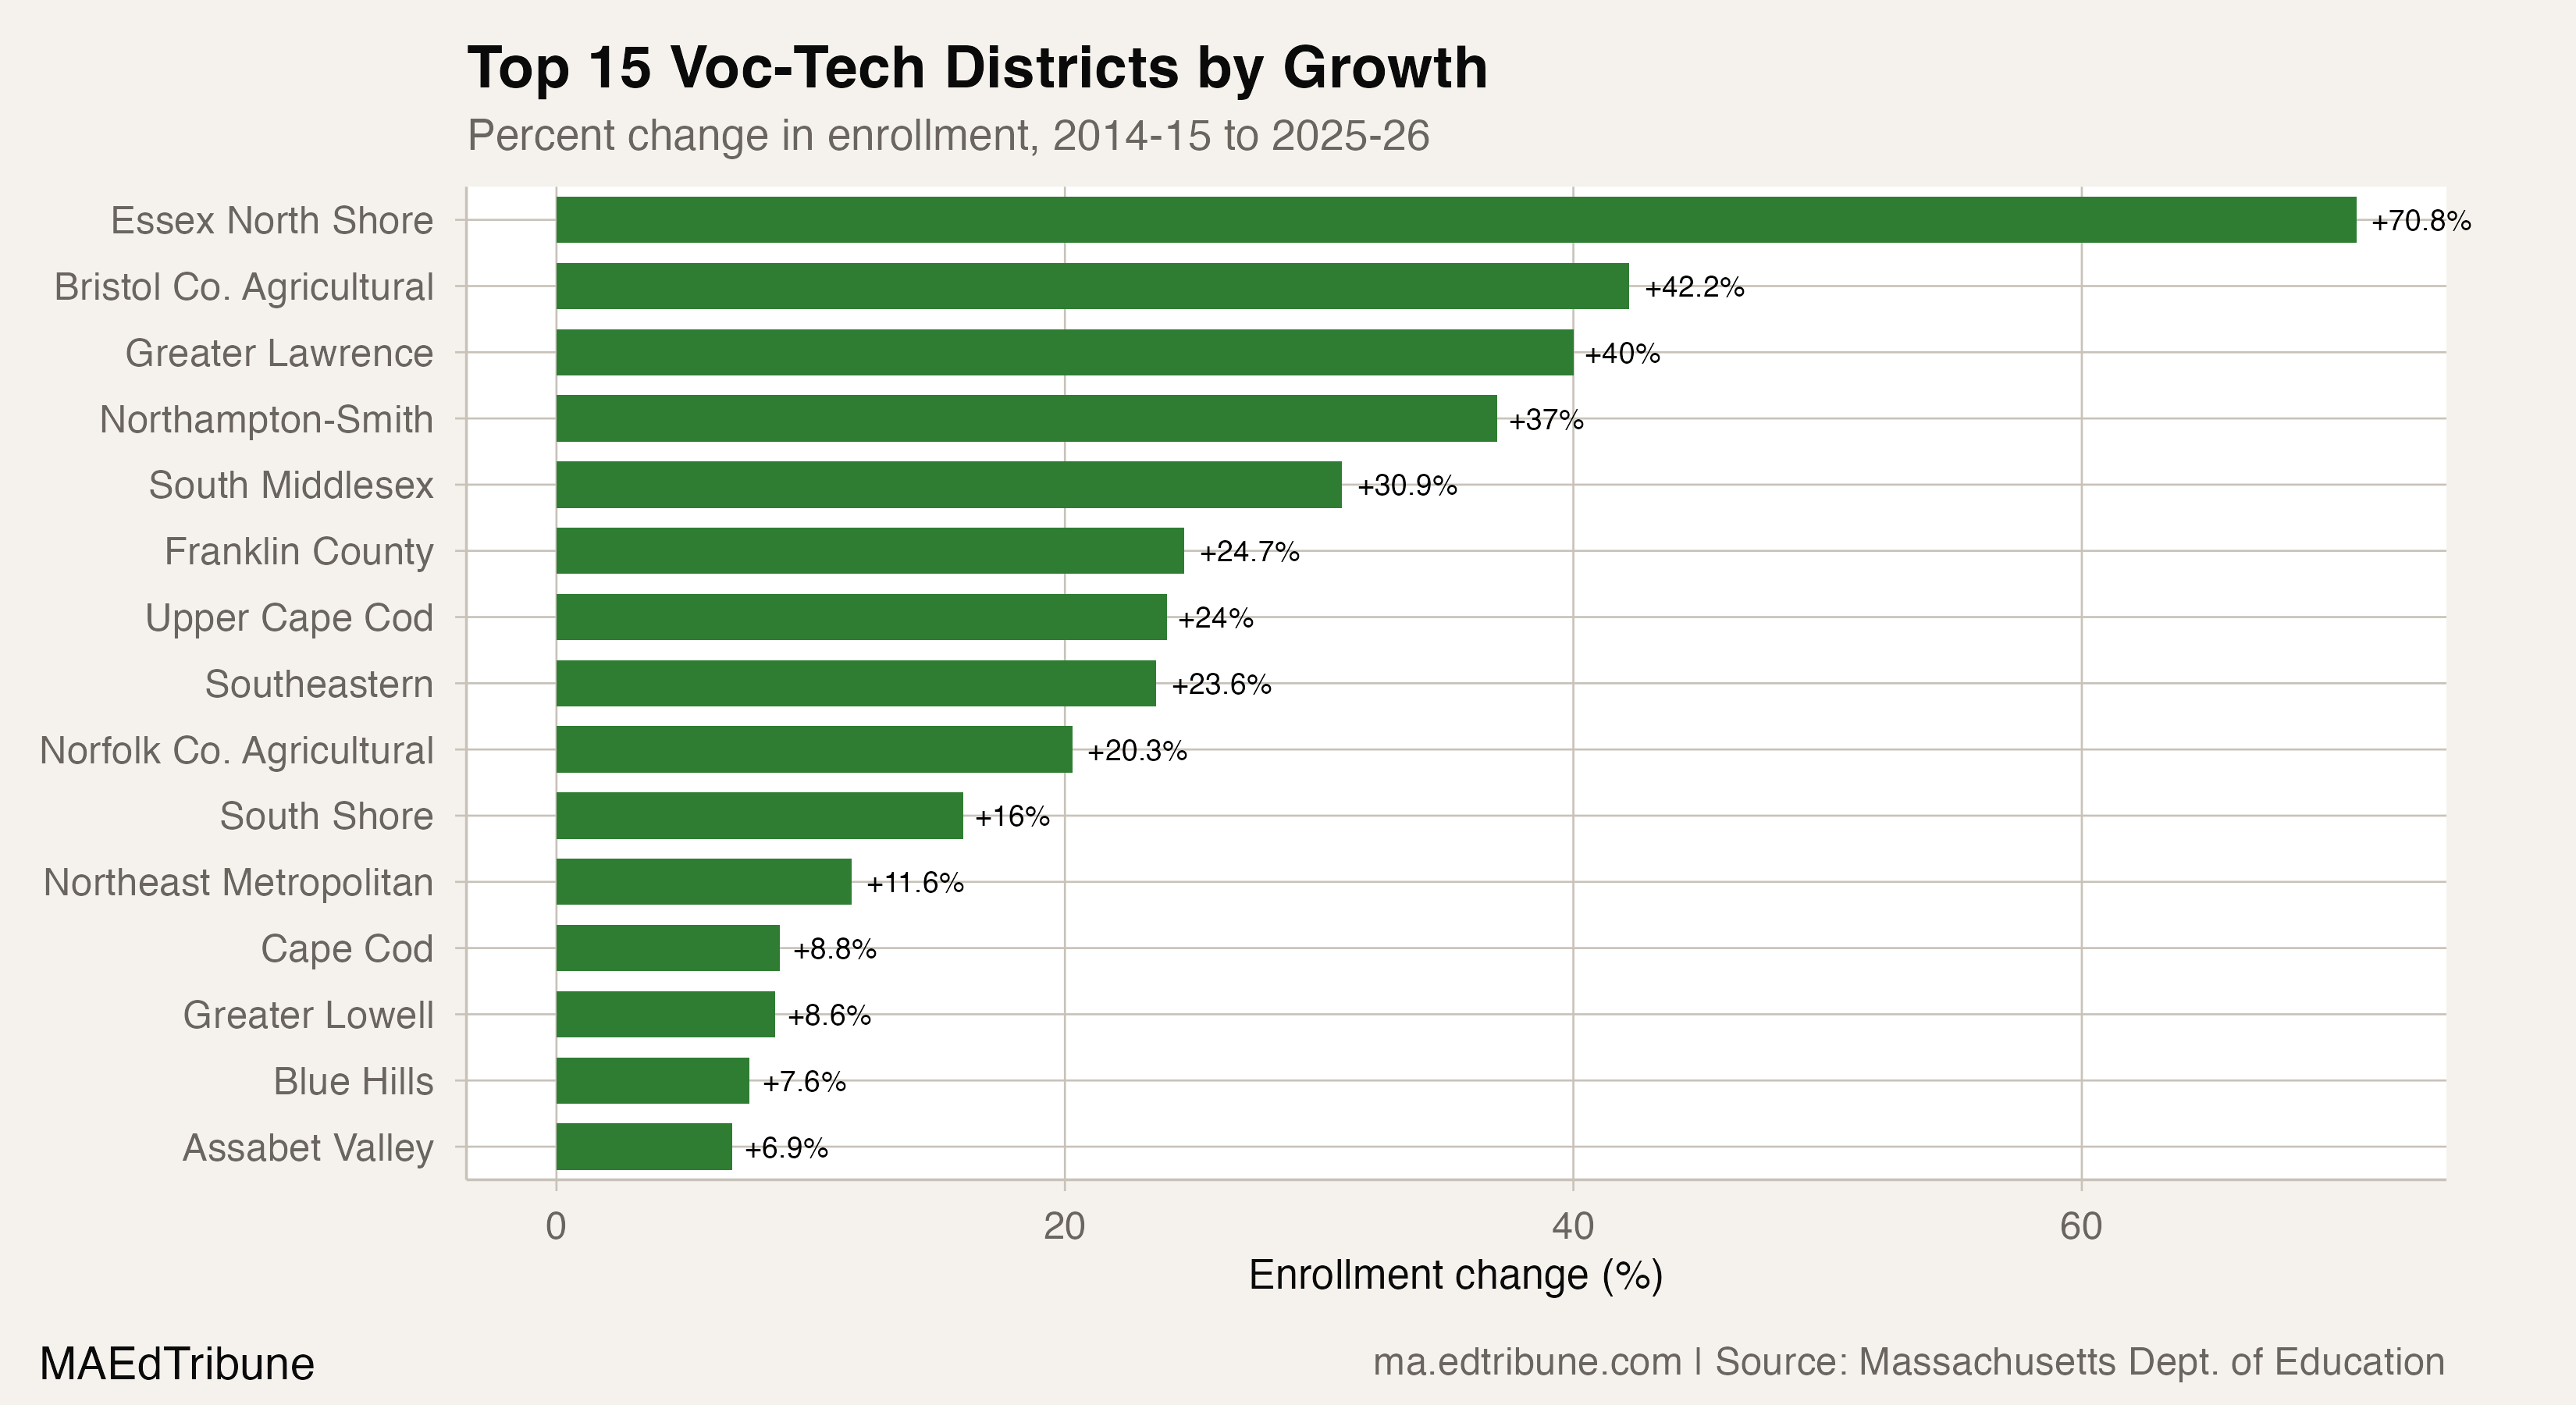
Essex North Shore Agricultural and Technical↗ET has grown 70.8% in 11 years. Greater Lawrence Regional Vocational Technical↗ET has grown 40%. Southeastern Regional Vocational Technical↗ET has grown 23.6%. These three schools share something no traditional district in Massachusetts can claim: they have added students every single year since 2014-15, an unbroken 11-year streak of growth in a state that has lost 55,000 students over the same period.
They are all vocational-technical schools.
The divergence
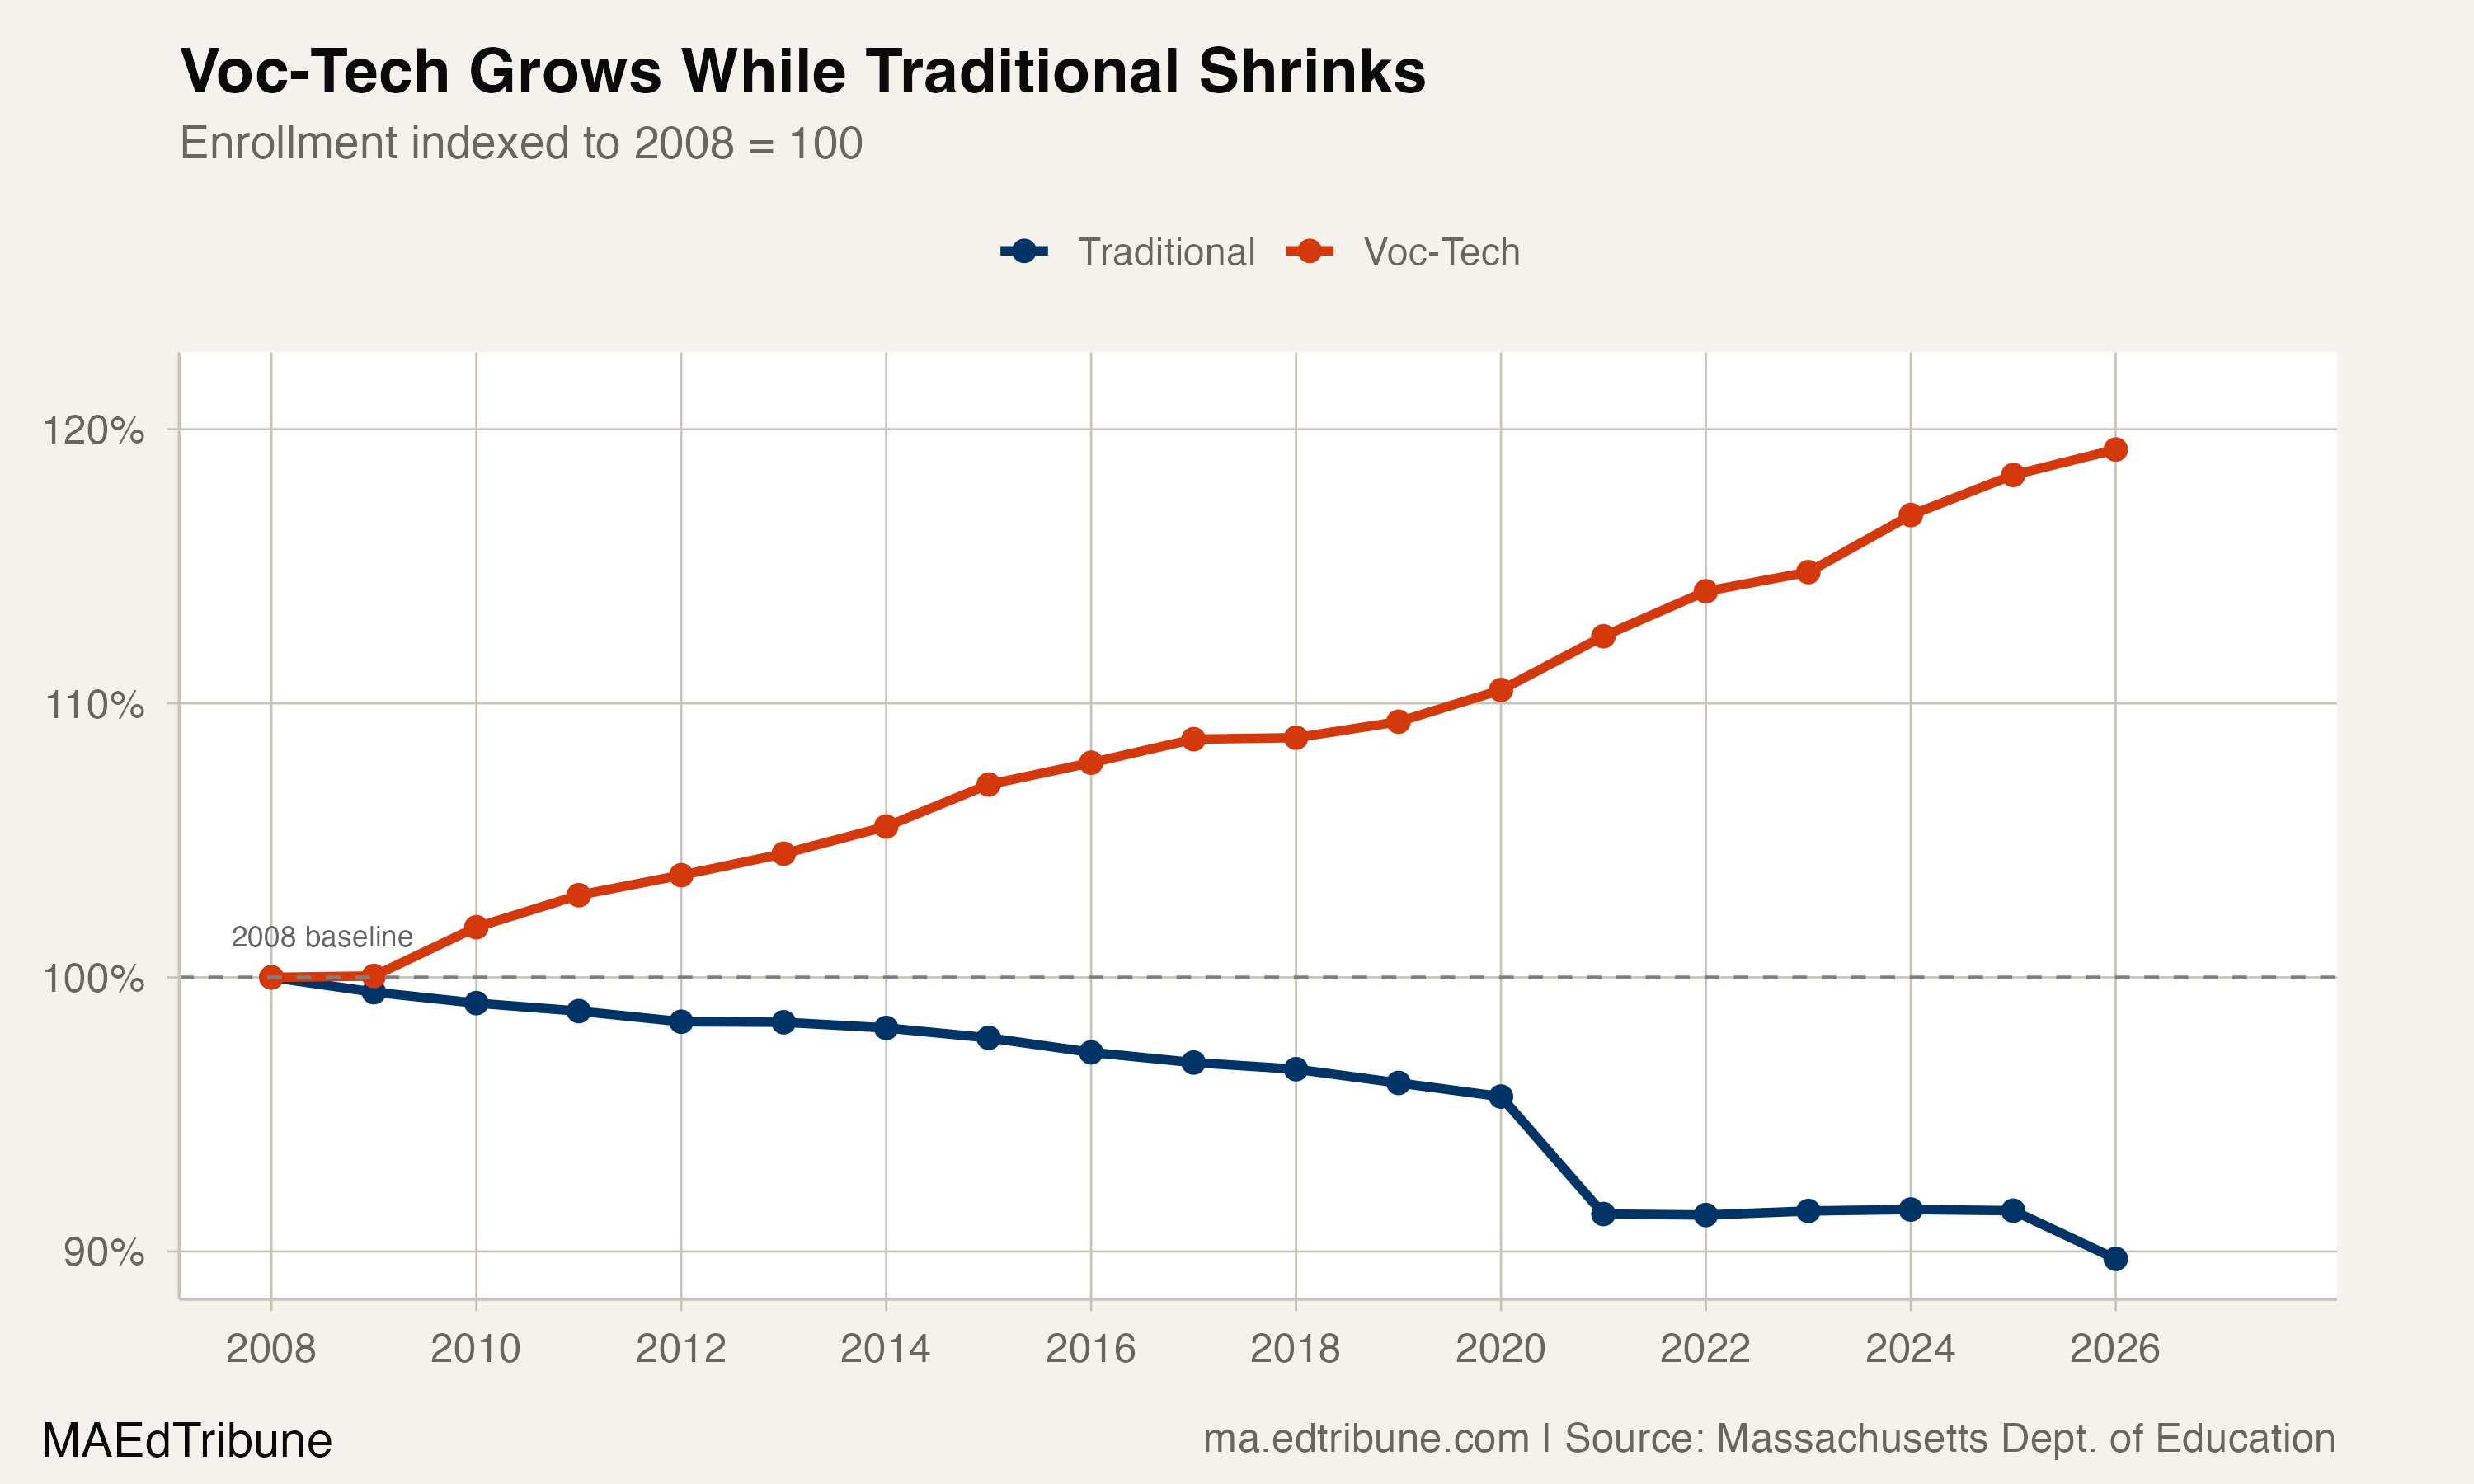
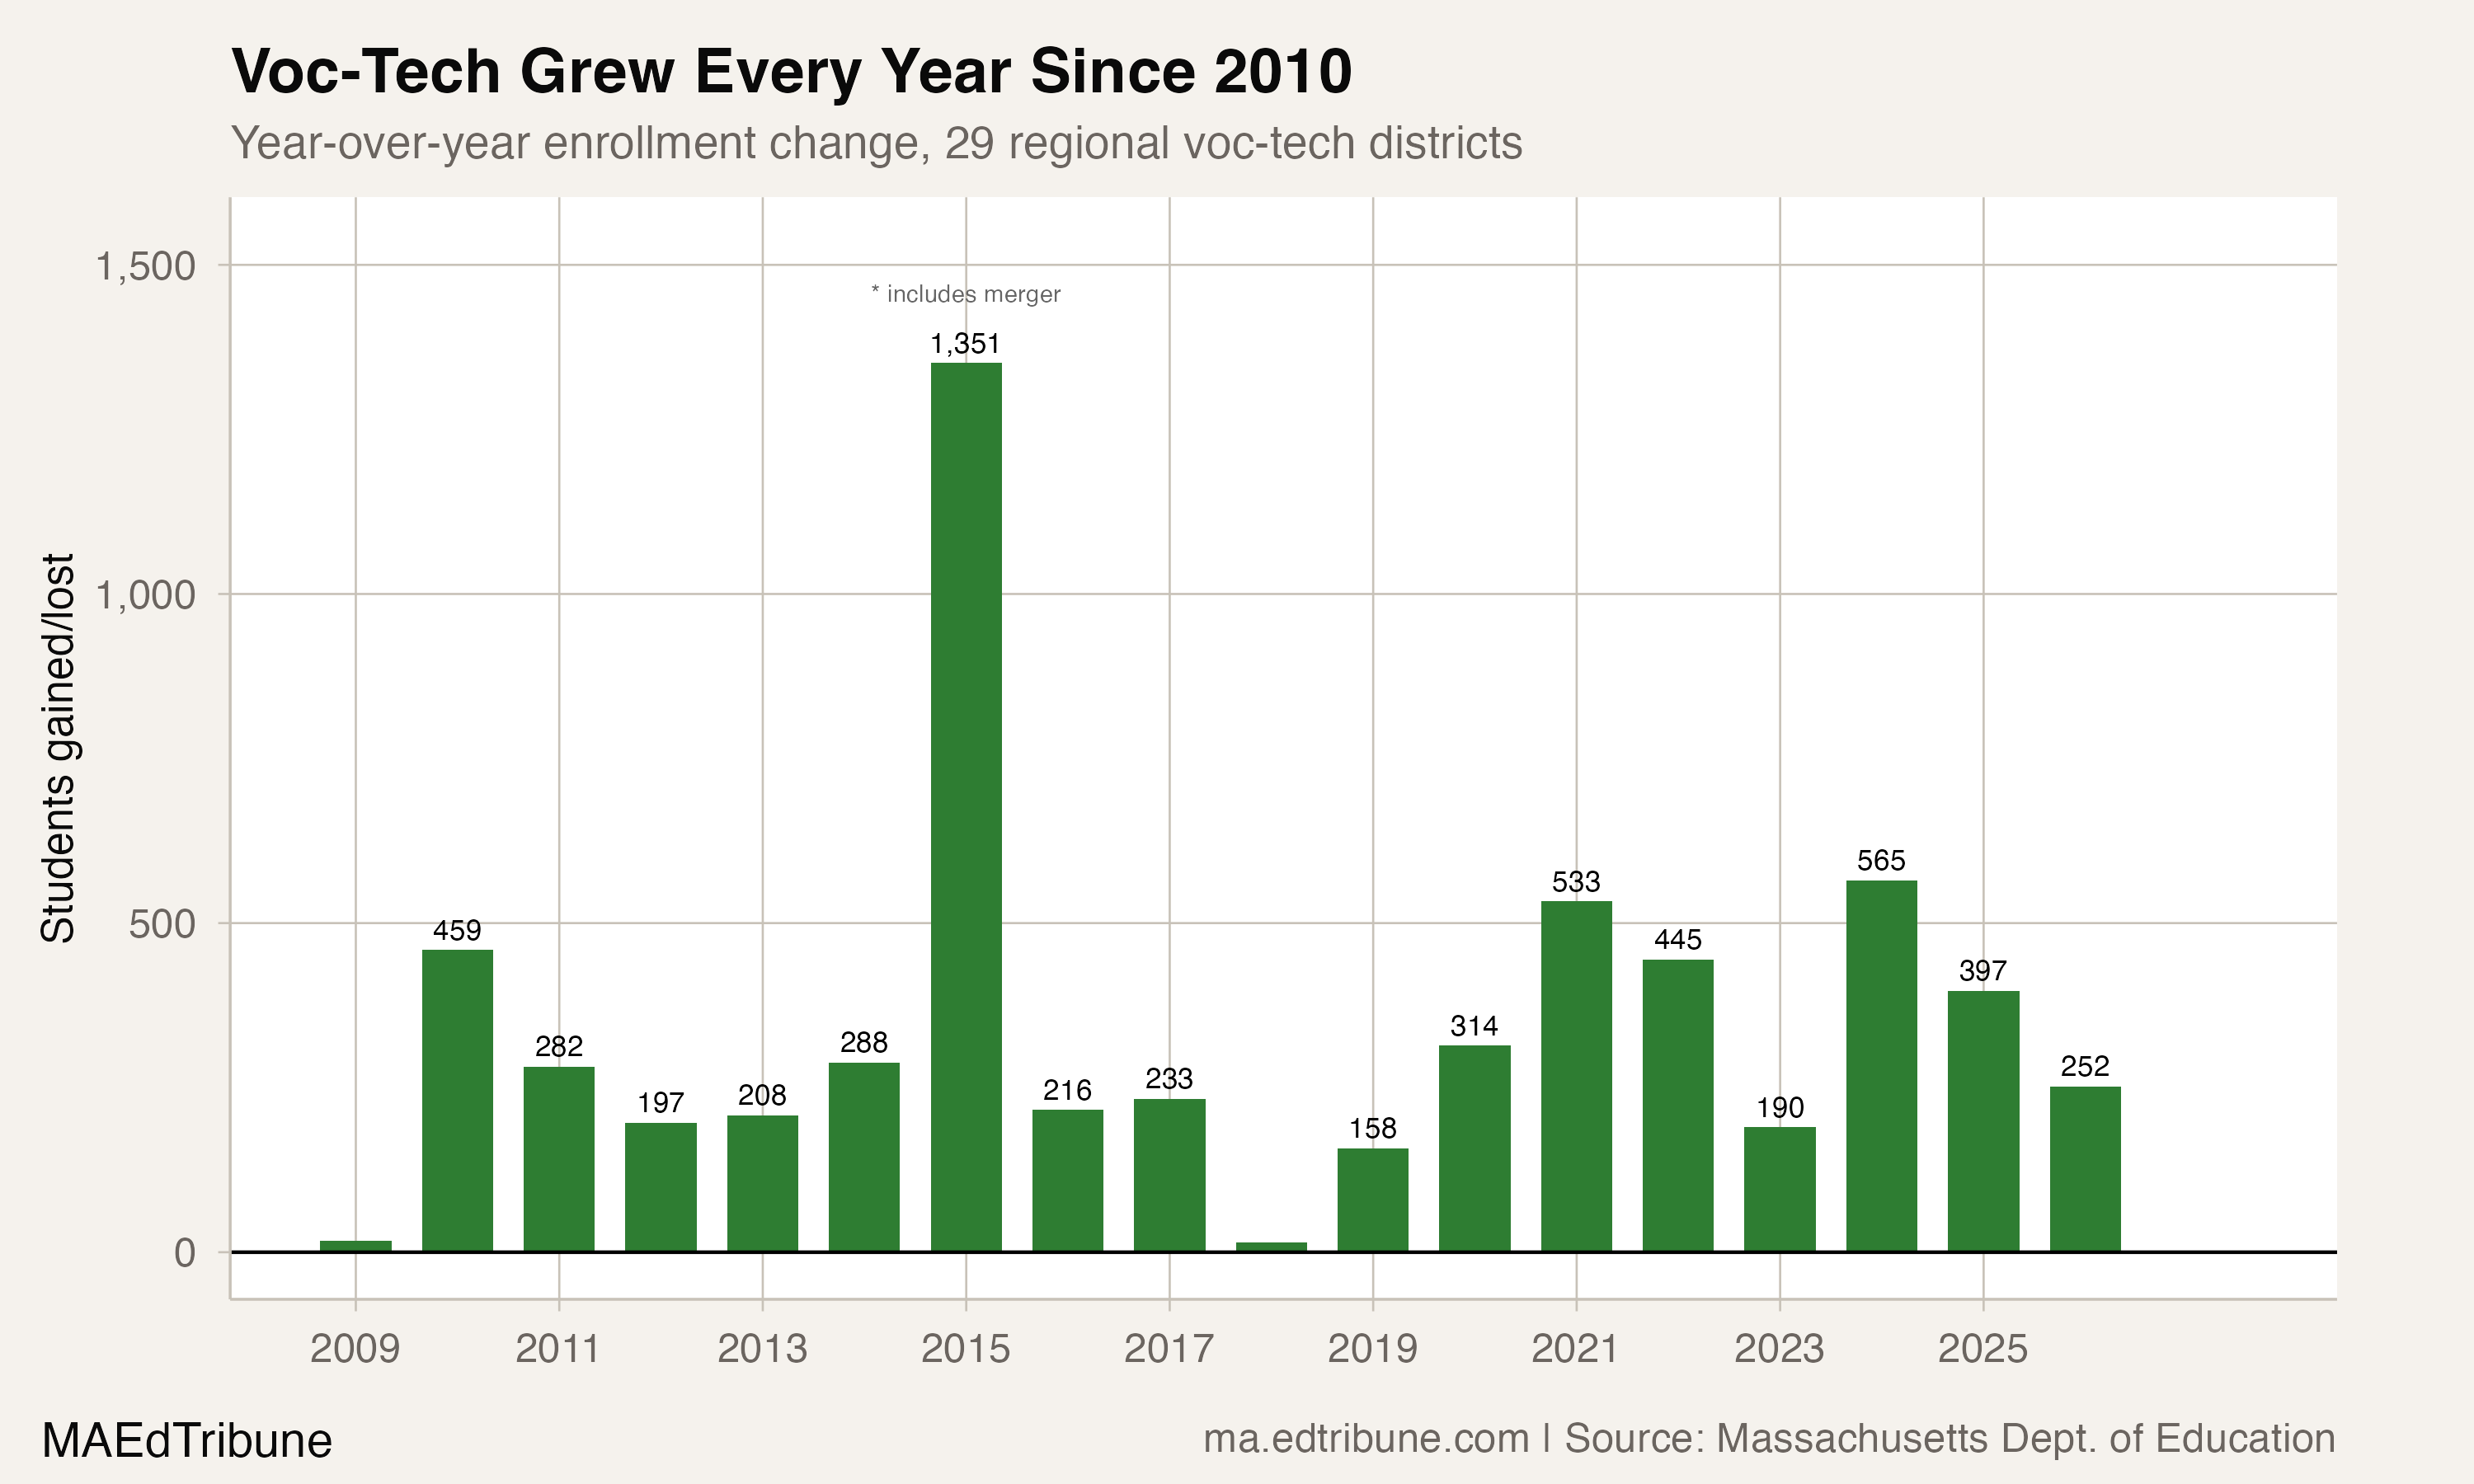
Massachusetts has 29 regional vocational-technical districts. Since 2007-08, their combined enrollment has grown from 27,145 to 32,373 students, a gain of 19.3%. Over the same period, traditional districts have lost 93,817 students, a decline of 10.3%. The voc-tech sector grew during every year of that span except one (2007-08, when it dipped by 35 students). Since 2008-09, the sector has posted 18 consecutive years of growth.
The growth is broad-based. Of the 29 active voc-tech districts, 22 have grown since 2014-15. The top performers are concentrated in two categories: the merged or restructured schools (Essex North Shore, formed from the combination of North Shore Regional and Essex Agricultural Technical in 2014) and the agricultural-technical schools (Bristol County Agricultural↗ET, up 42.2%; Northampton-Smith↗ET, up 37.0%). But even the largest programs are growing. Greater Lowell↗ET, the state's biggest voc-tech district at 2,312 students, has gained 8.6% since 2014-15. Greater New Bedford↗ET, the second-largest at 2,161, has gained 0.9%.
8,100 seats short
The growth in enrollment understates the demand. According to a Pioneer Institute study, Massachusetts faces an 8,100-seat shortage in career/vocational technical education. The Massachusetts Association of Vocational Administrators estimates that between 6,000 and 11,000 students sit on waitlists in any given year. About 42% of roughly 20,000 applicants are denied admission each year, not for academic reasons but for lack of space.
In Gateway Cities, the rejection rate is even steeper. Half the applicants are turned away. Smith Vocational in Northampton receives over 300 applications for 150 freshman seats. Franklin County Technical↗ET has grown 24.7% in 11 years and still cannot accommodate demand.
"That interest is statewide. Over 1,000 students aren't getting in." -- Andrew Linkenhoker, Smith Vocational Superintendent, Daily Hampshire Gazette, Nov. 2025
The constrained supply means the enrollment numbers in this analysis represent a floor, not a ceiling. Actual demand for vocational education in Massachusetts is substantially higher than what the enrollment data can show.
What families are choosing
The most likely driver is shifting family preferences about the value of a four-year college degree. College tuition increased 213% from 1987 to 2017, and families increasingly view vocational training as a path to financial stability without student loan debt. Franklin County Technical School estimates 25% of its graduates attend college afterward, while most enter the trades directly. At Worcester Technical High School, about 60% of graduates pursue two- or four-year colleges, suggesting voc-tech schools are functioning as both career pipelines and college-prep alternatives.
You could attribute voc-tech's rising share to the traditional sector shrinking around it, but the absolute numbers don't support that. Voc-tech has added 5,228 students since 2008 while the state lost 62,316. These are net new enrollments, not transfers from closing traditional schools.
The equity question
The voc-tech sector's demographics diverge from the state's. Voc-tech students are 60.8% white, compared to 50.8% statewide. Black students make up 6.9% of voc-tech enrollment versus 10.4% statewide. The gap is sharpest for English learners: 3.7% of voc-tech students are classified as LEP, compared to 13.4% statewide. Asian students are similarly underrepresented at 2.6% versus 7.6%.
These disparities prompted a federal civil rights complaint from Lawyers for Civil Rights and the Center for Law and Education. The complaint documented that during the 2022-23 school year, 69% of white applicants were admitted versus 55% of students of color. Students with disabilities and English learners faced even wider gaps: 54% and 44% admission rates, respectively, compared to 65% and 64% for their peers.
In response, the Board of Elementary and Secondary Education voted 8-2 in May 2025 to require lottery-based admissions for oversubscribed voc-tech schools, replacing the selective criteria (grades, attendance, interviews, and recommendations) that advocacy groups argued favored more advantaged applicants. The Legislature subsequently paused the policy, preventing implementation before the 2026-27 admissions cycle and creating a task force to study the issue.
Three sectors, three futures
Voc-tech's 19.3% growth looks modest against the charter sector's 118.4% expansion over the same period. But the comparison obscures a key structural difference: charter schools started from a much smaller base (22,199 students in 2008 versus 27,145 for voc-tech) and grew partly through new school openings. Voc-tech's growth came almost entirely within existing capacity, which makes the 8,100-seat shortage all the more striking.
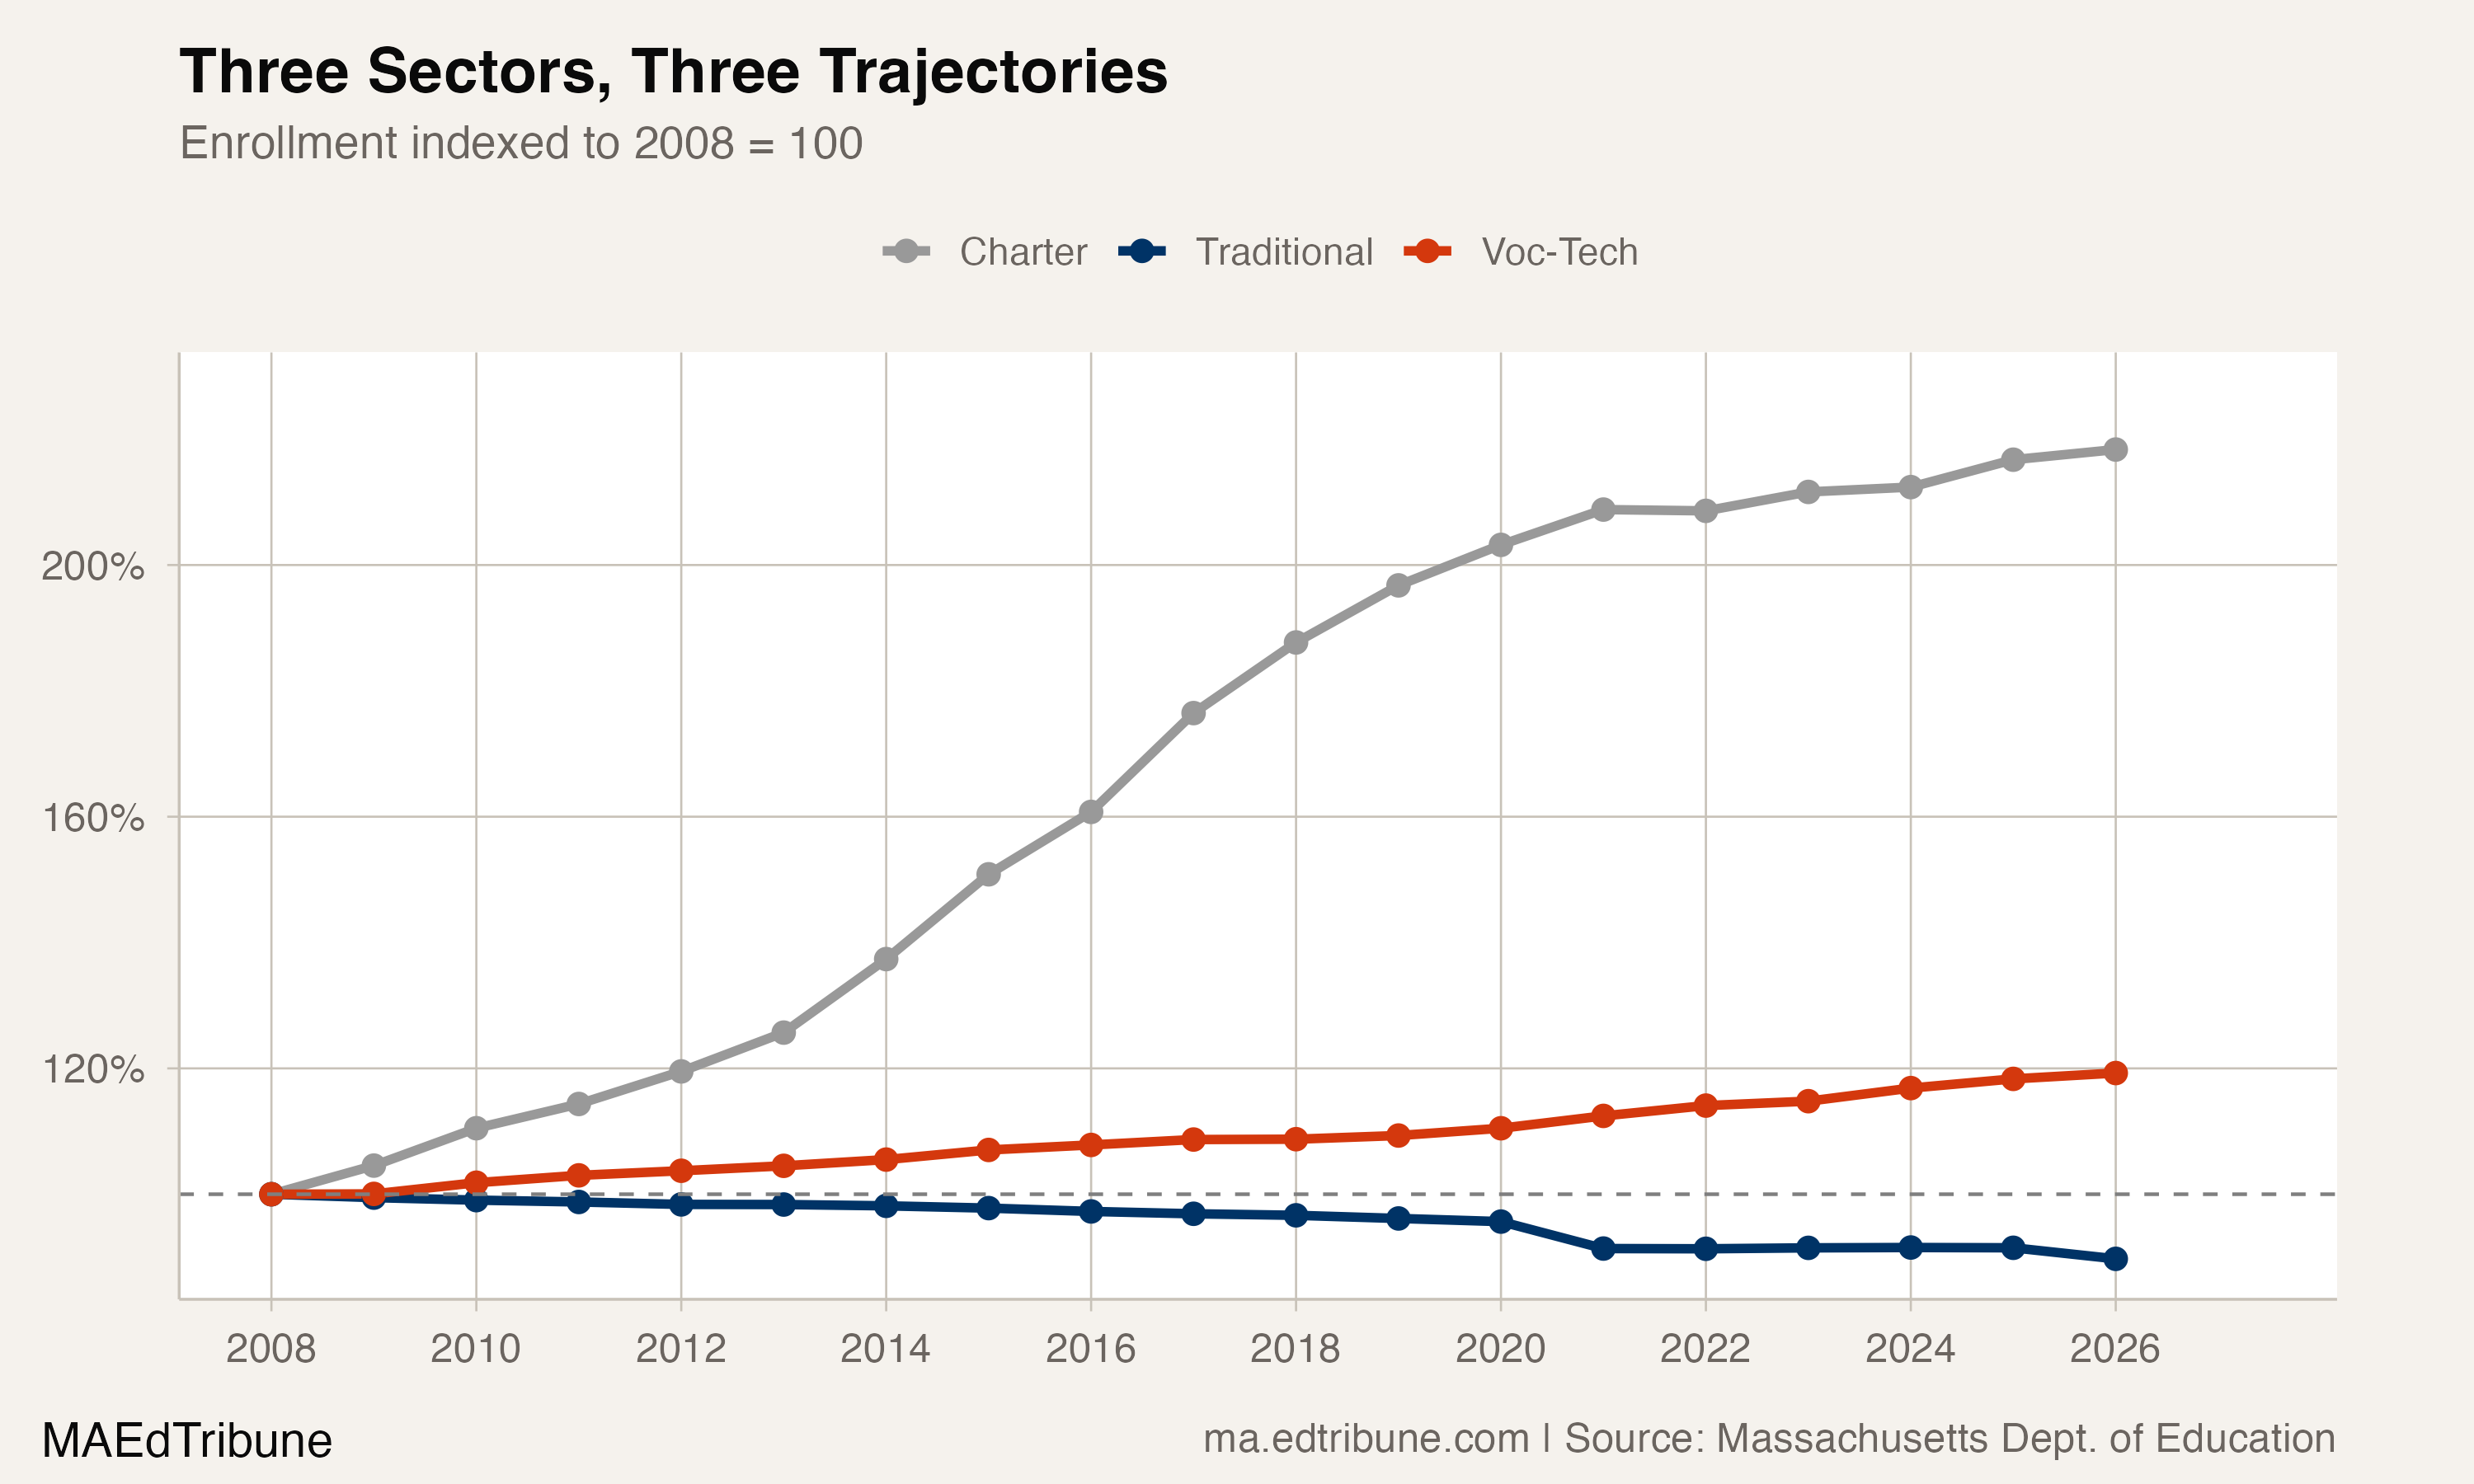
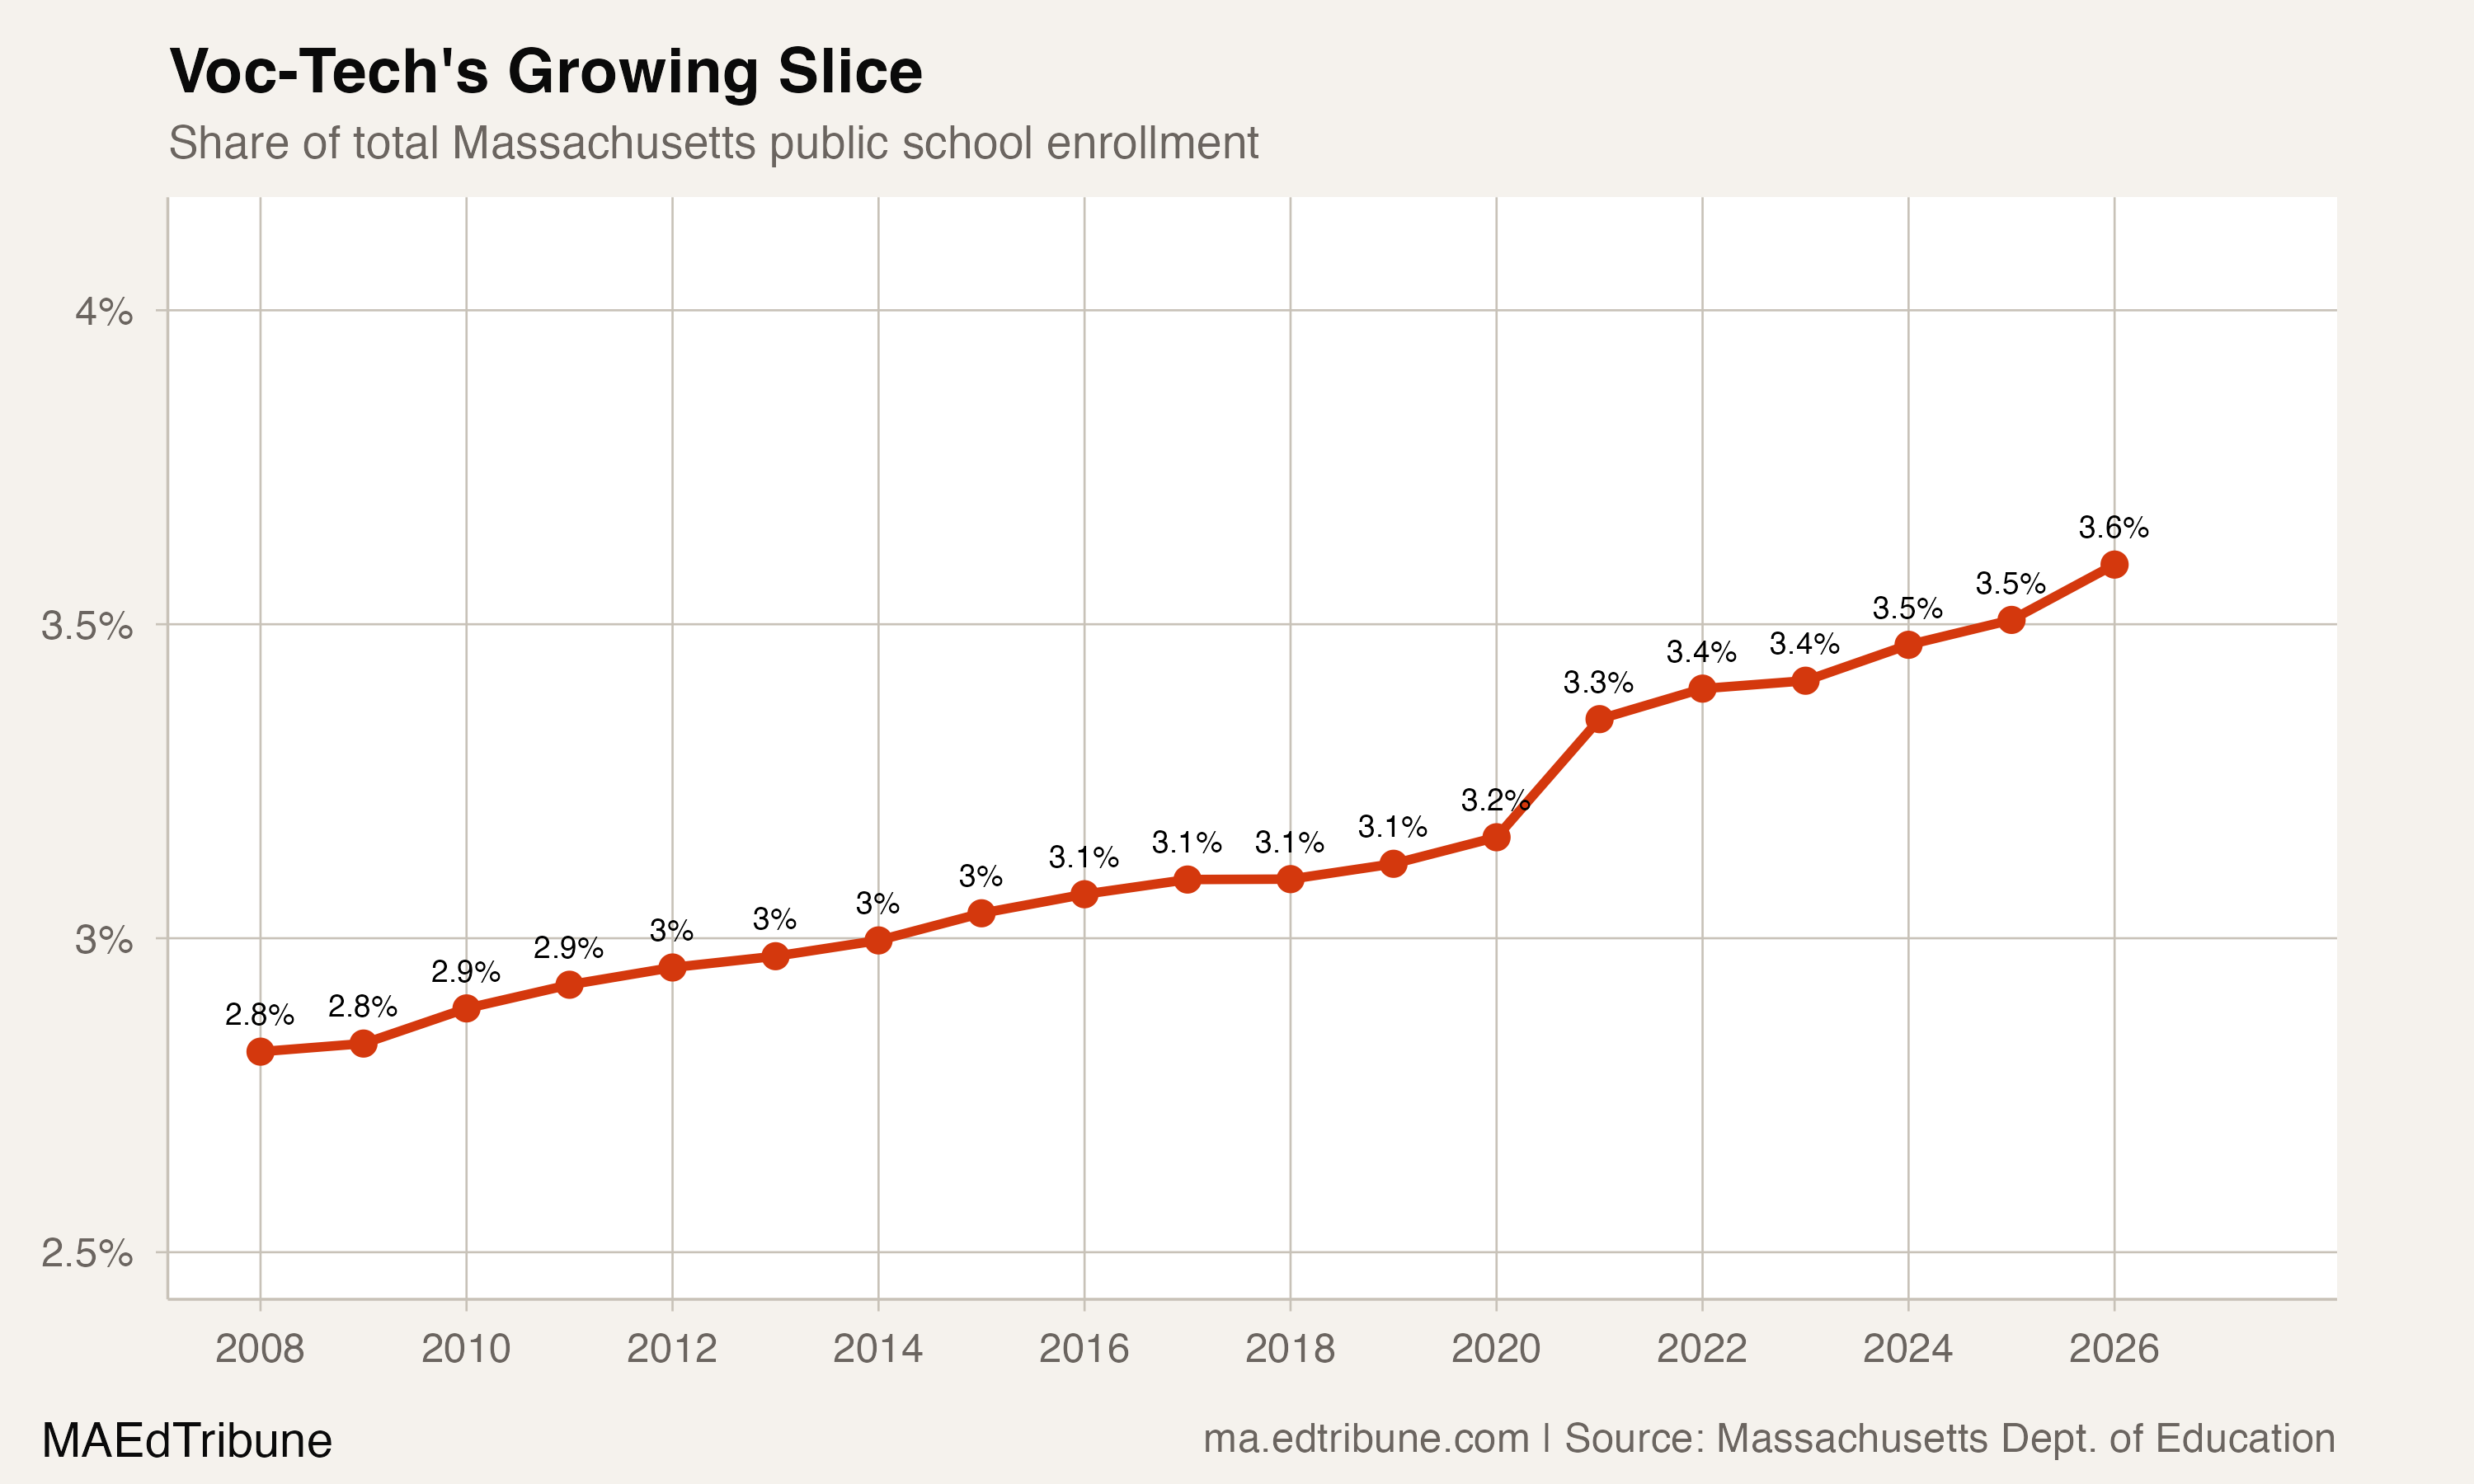
The sector's share of total state enrollment has risen from 2.8% in 2008 to 3.6% in 2026. That share would likely be higher if capacity existed to absorb the thousands of students on waitlists.
The Healey administration has committed to expansion. The administration proposed $75 million in Career Technical Education grants to create 3,000 new seats over three years. The administration has also opened applications for $60 million in CTE capital grants to support over 2,000 additional seats. Even if fully realized, these 5,000 new seats would not close the 8,100-seat gap.
The COVID-19 pandemic offered a natural experiment in sector resilience. In 2020-21, when traditional districts lost 4.5% of their students, voc-tech enrollment grew 1.8%. The same pattern held among the state's 80.1% of traditional districts that have lost enrollment since 2008: voc-tech's 25 of 29 districts growing stands as a near-mirror image.
The Healey administration's 3,000 new seats would not close the 8,100-seat gap. The Legislature paused the lottery admissions policy before it took effect. And Smith Vocational in Northampton still turns away more than half its applicants every spring. Three voc-tech schools have posted 11 straight years of growth while 80% of traditional districts shrink. The waiting list is the policy.
Detailed code that reproduces the analysis and figures in this article is available exclusively to EdTribune subscribers.
Discussion
Sign in to join the discussion.
Loading comments...