Absence
Massachusetts' Regional Voc-Tech Median Is 7.5 Points Below the Statewide Rate
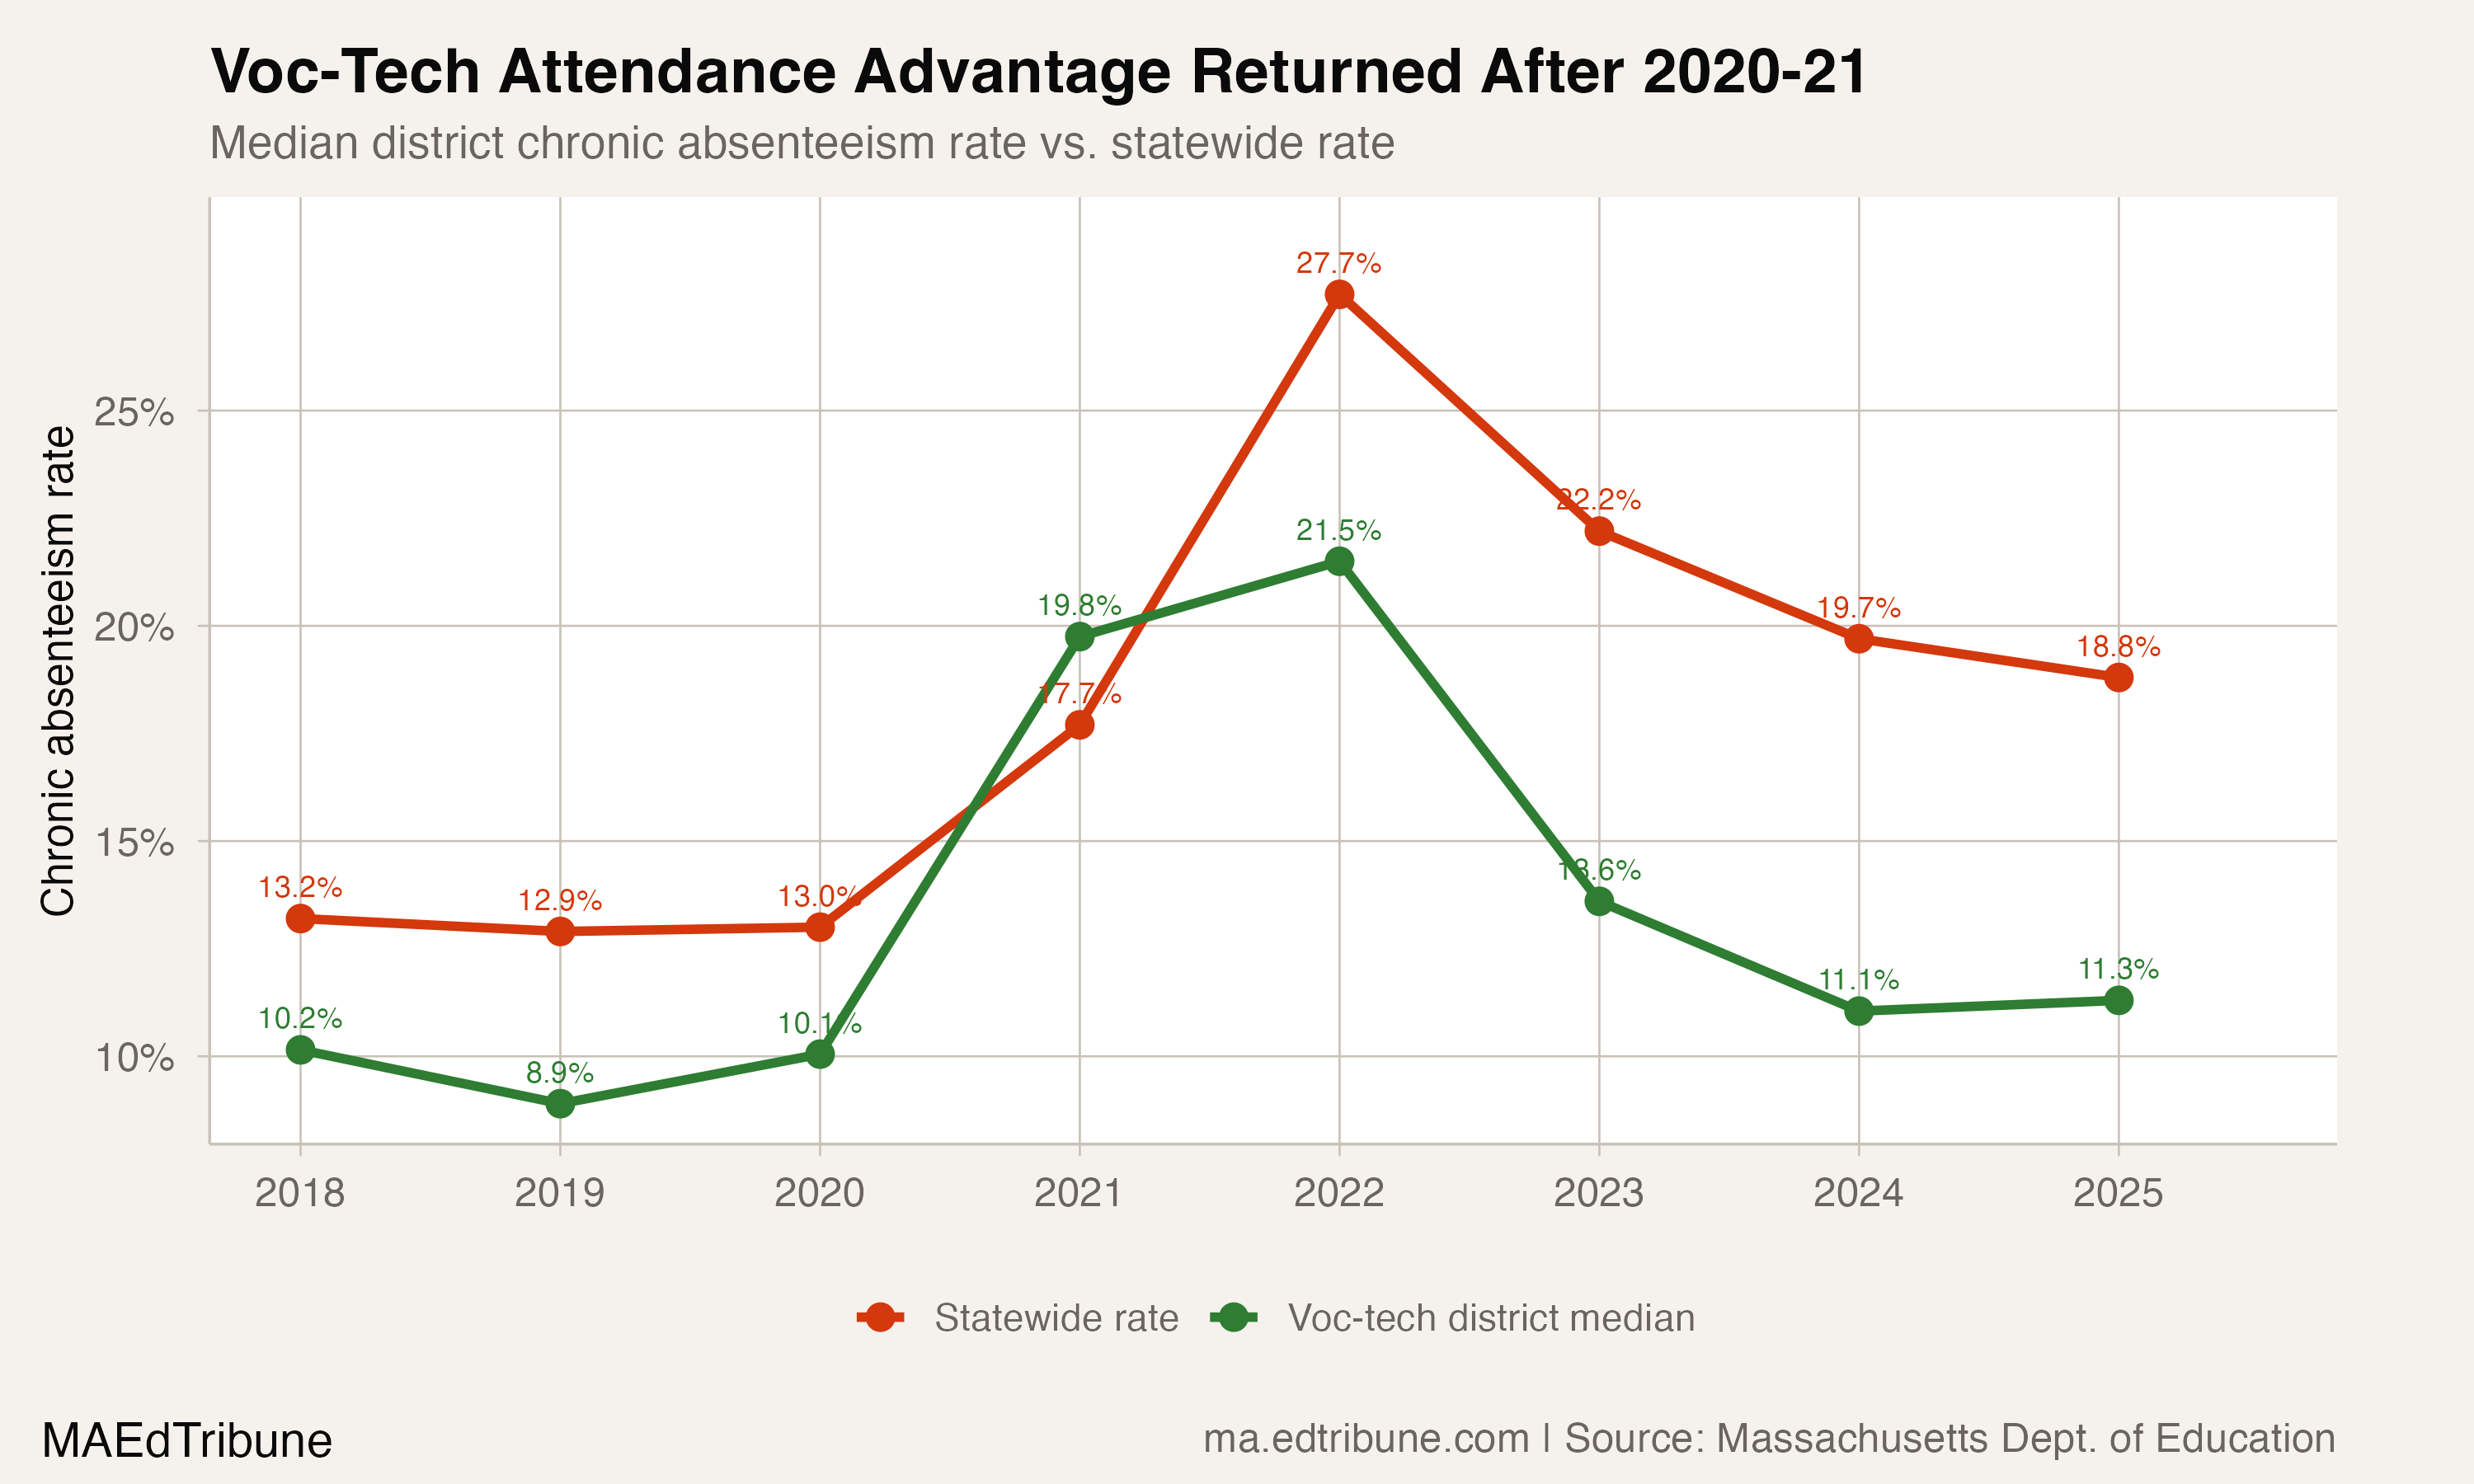
Across 26 regional voc-tech districts, the 2024-25 chronic absence median was 11.3%, 7.5 points below Massachusetts' statewide rate.
Data-Driven Education Journalism for the Bay State
Education News & Data
Local education reporting from every corner of Massachusetts, grounded in Massachusetts Department of Education data.
Northampton enrolled 2,382 students in 2025-26, down 11.8 percent since 2014-15 against 5.6 percent statewide. Its superintendent calls enrollment feedback.
Daniel Paquette steps into Westfield Technical Academy's principal role with a focus on continuity, CTE-academic alignment, and capacity.
Holliston Superintendent Kimo Carter outlines a listening tour as 2025-26 data show rising special education service demand.
Special education students in MA miss school at 26.5%, 7.7 points above the overall rate. The gap predates COVID, widened during the pandemic, and has barely narrowed since.
Across 26 regional voc-tech districts, the 2024-25 chronic absence median was 11.3%, 7.5 points below Massachusetts' statewide rate.
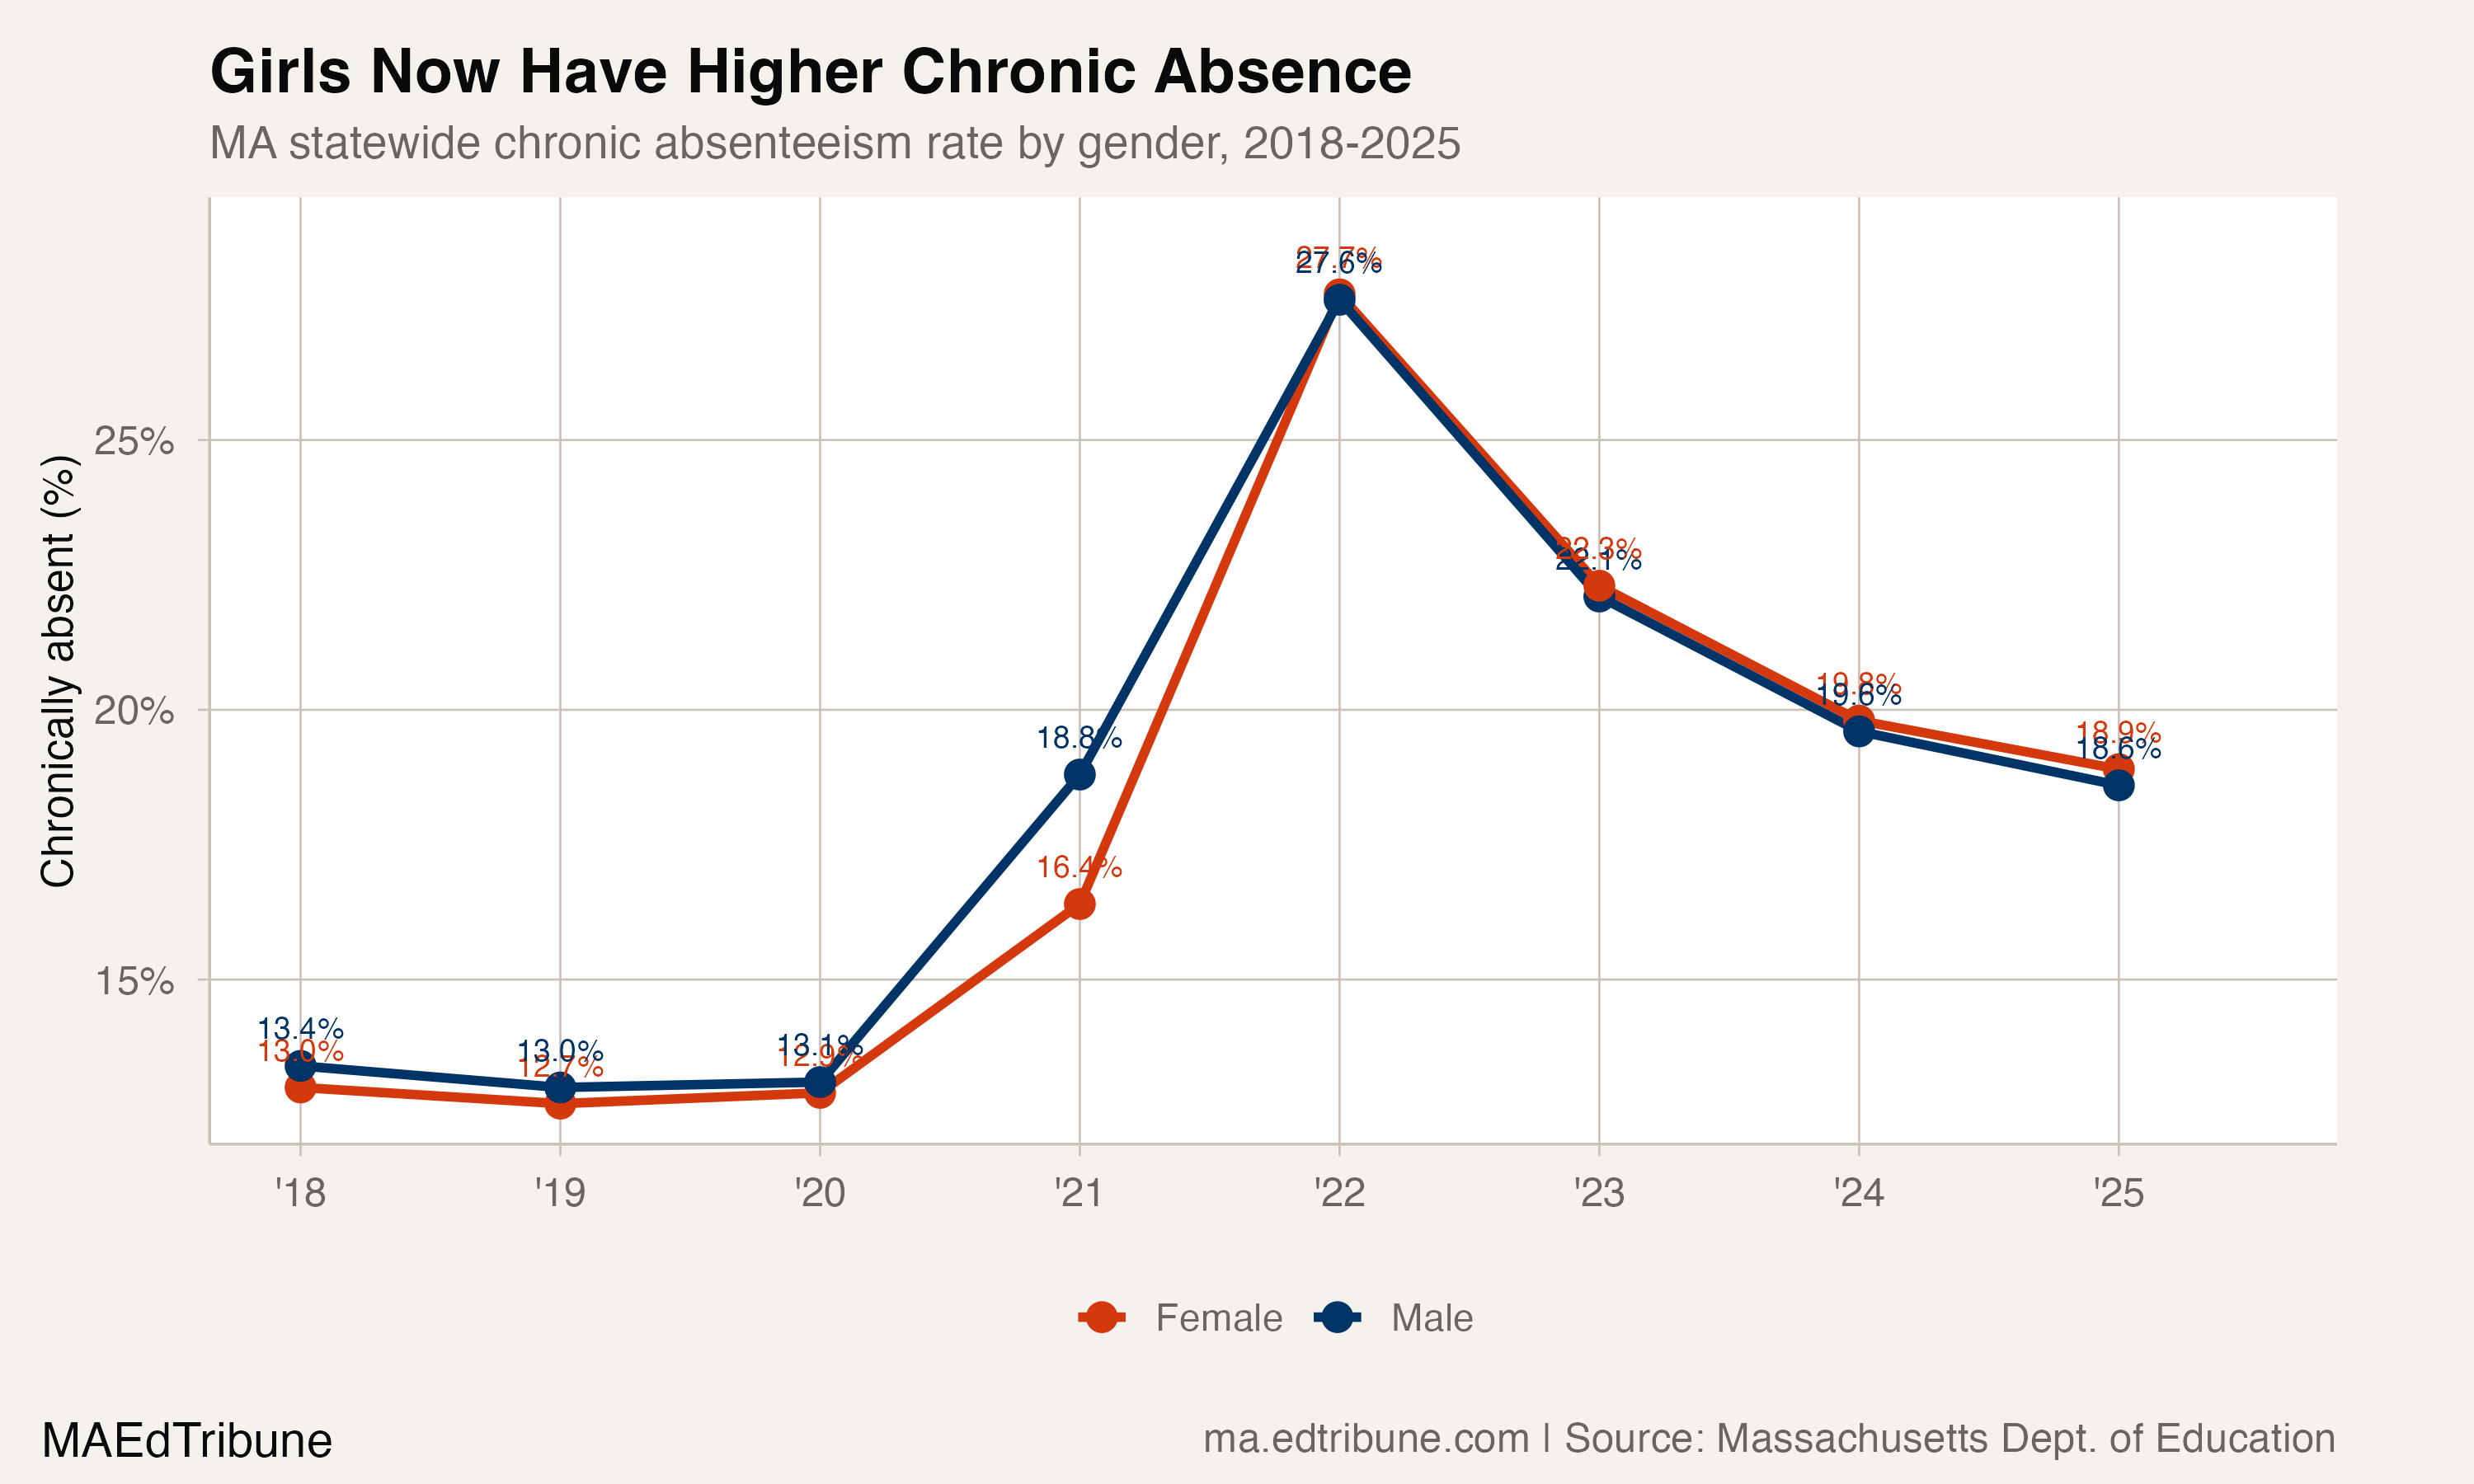
Before the pandemic, boys in MA had higher chronic absenteeism. Since 2022, girls have led every year. In 2025, 58.7% of districts showed the same flip.
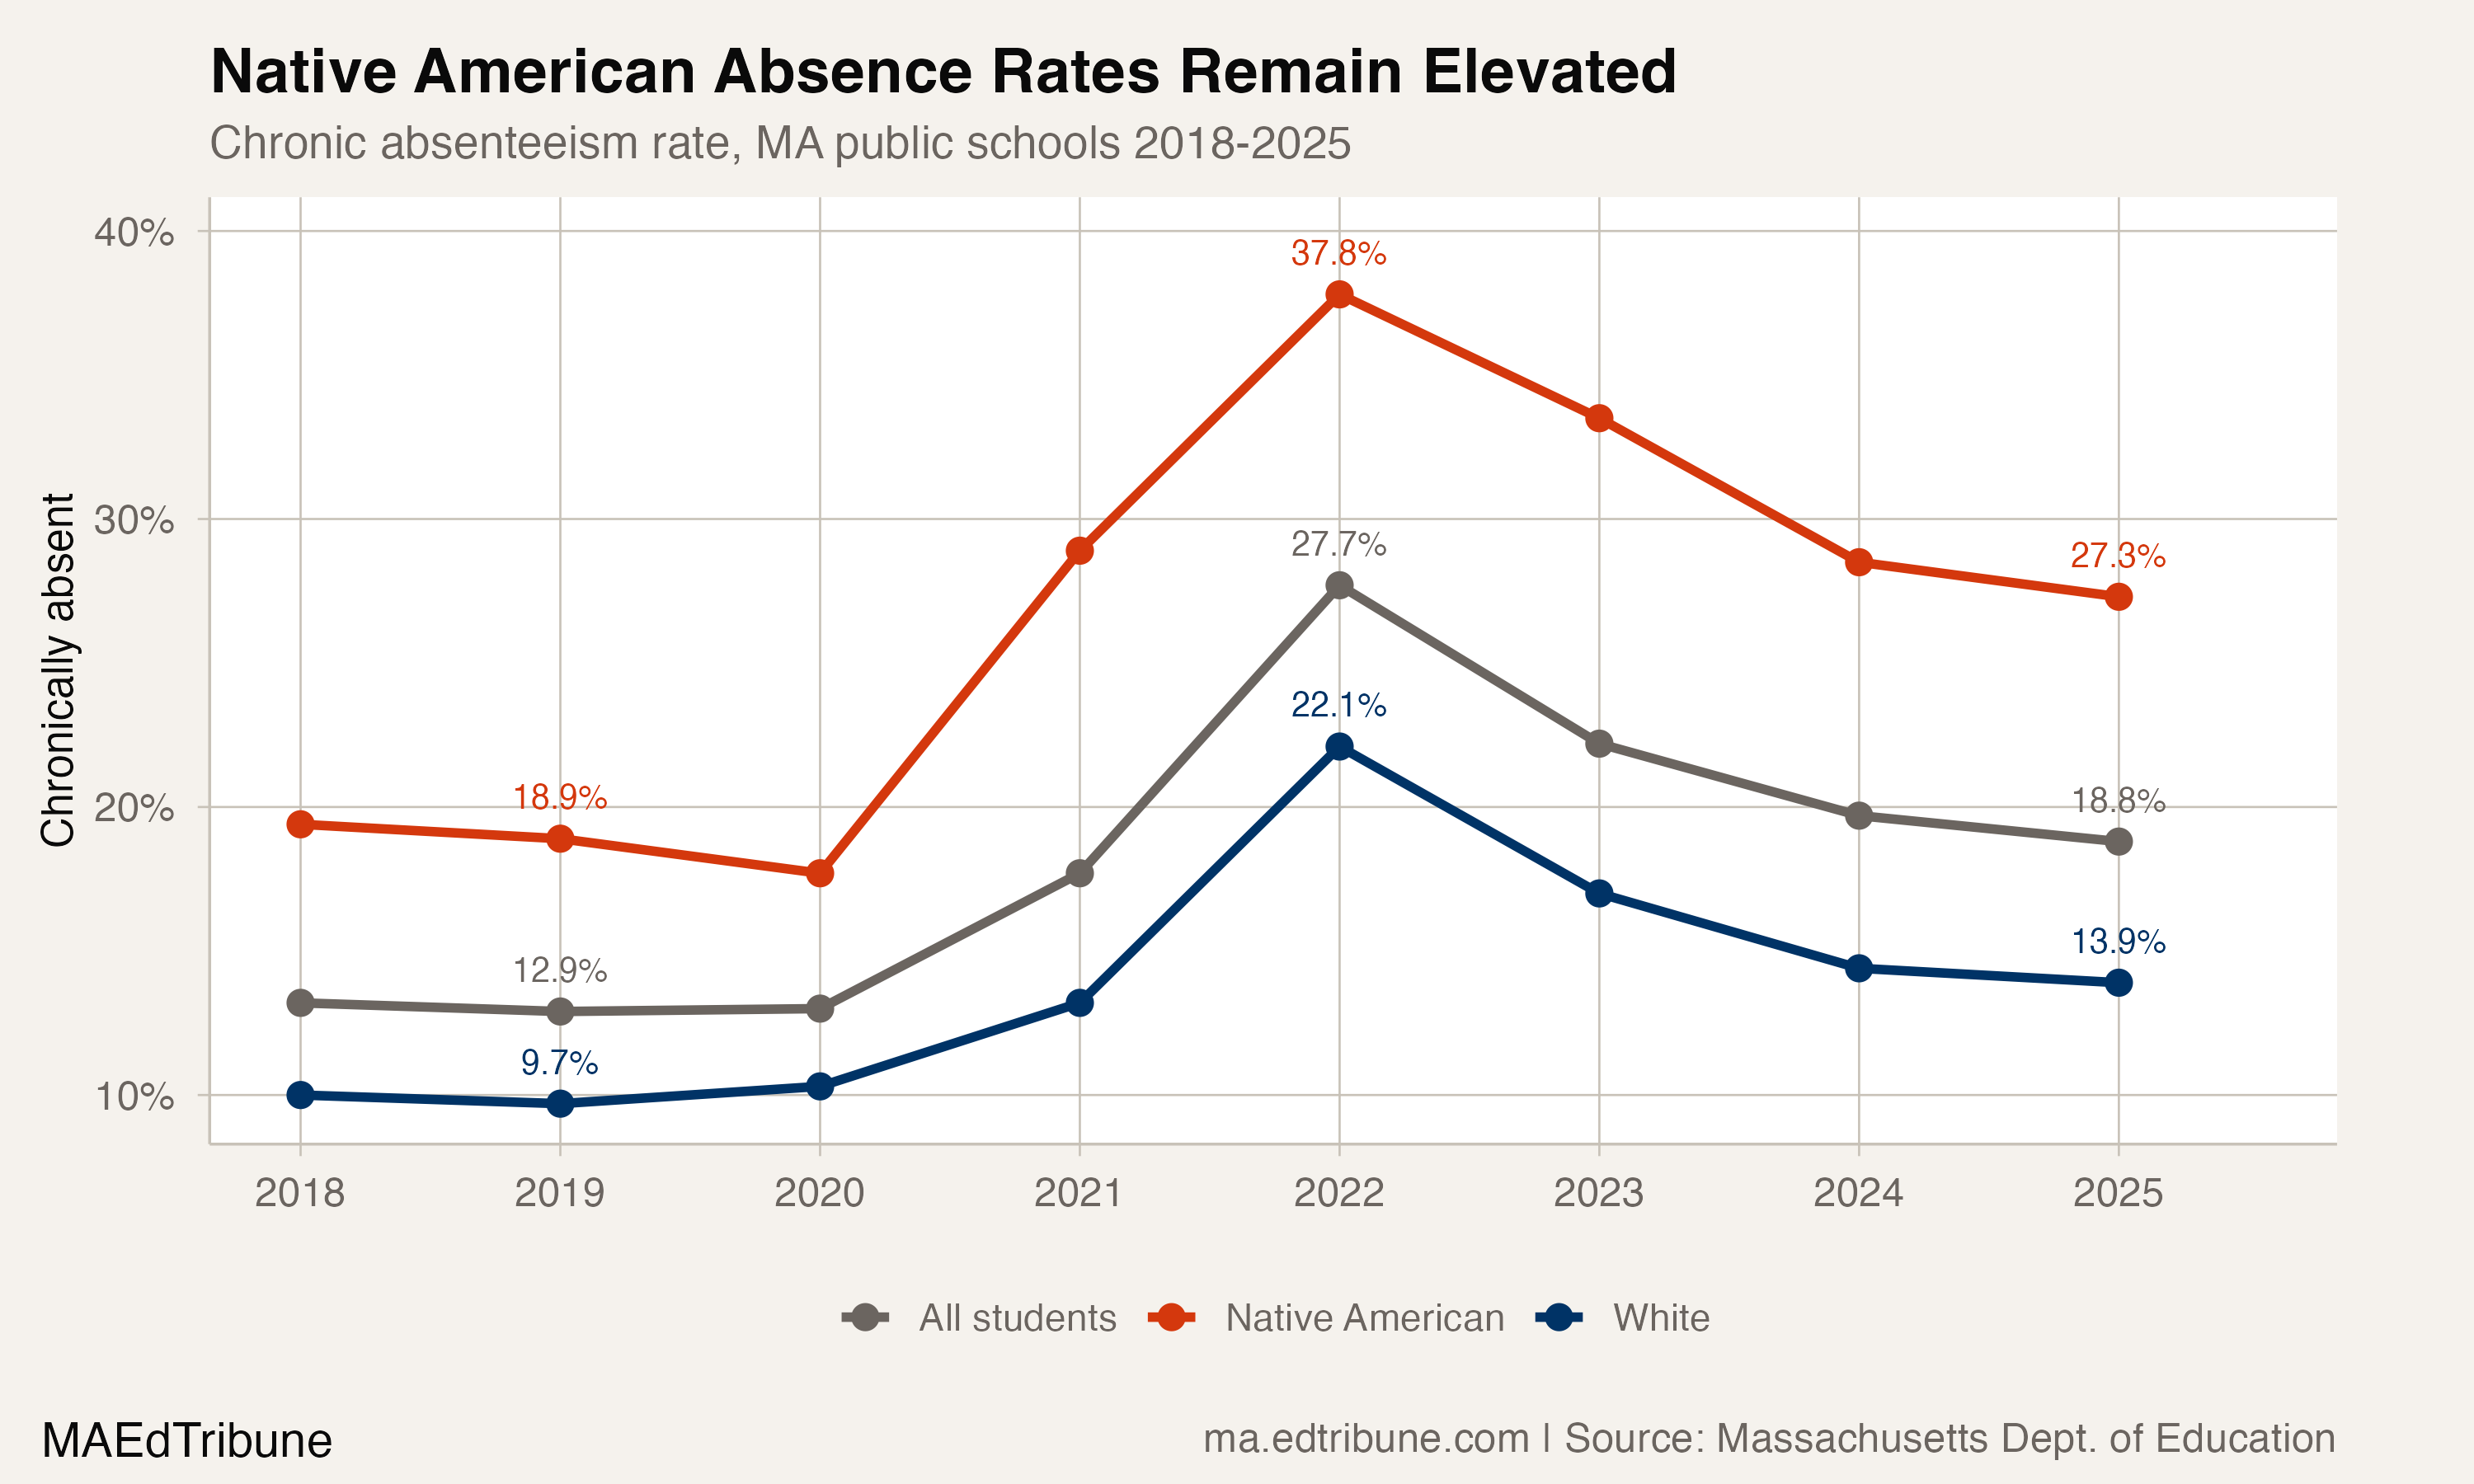
Massachusetts's Native American-white chronic-absence gap widened 4.2 points from 2019 to 2025, the largest increase among six reported race comparisons.
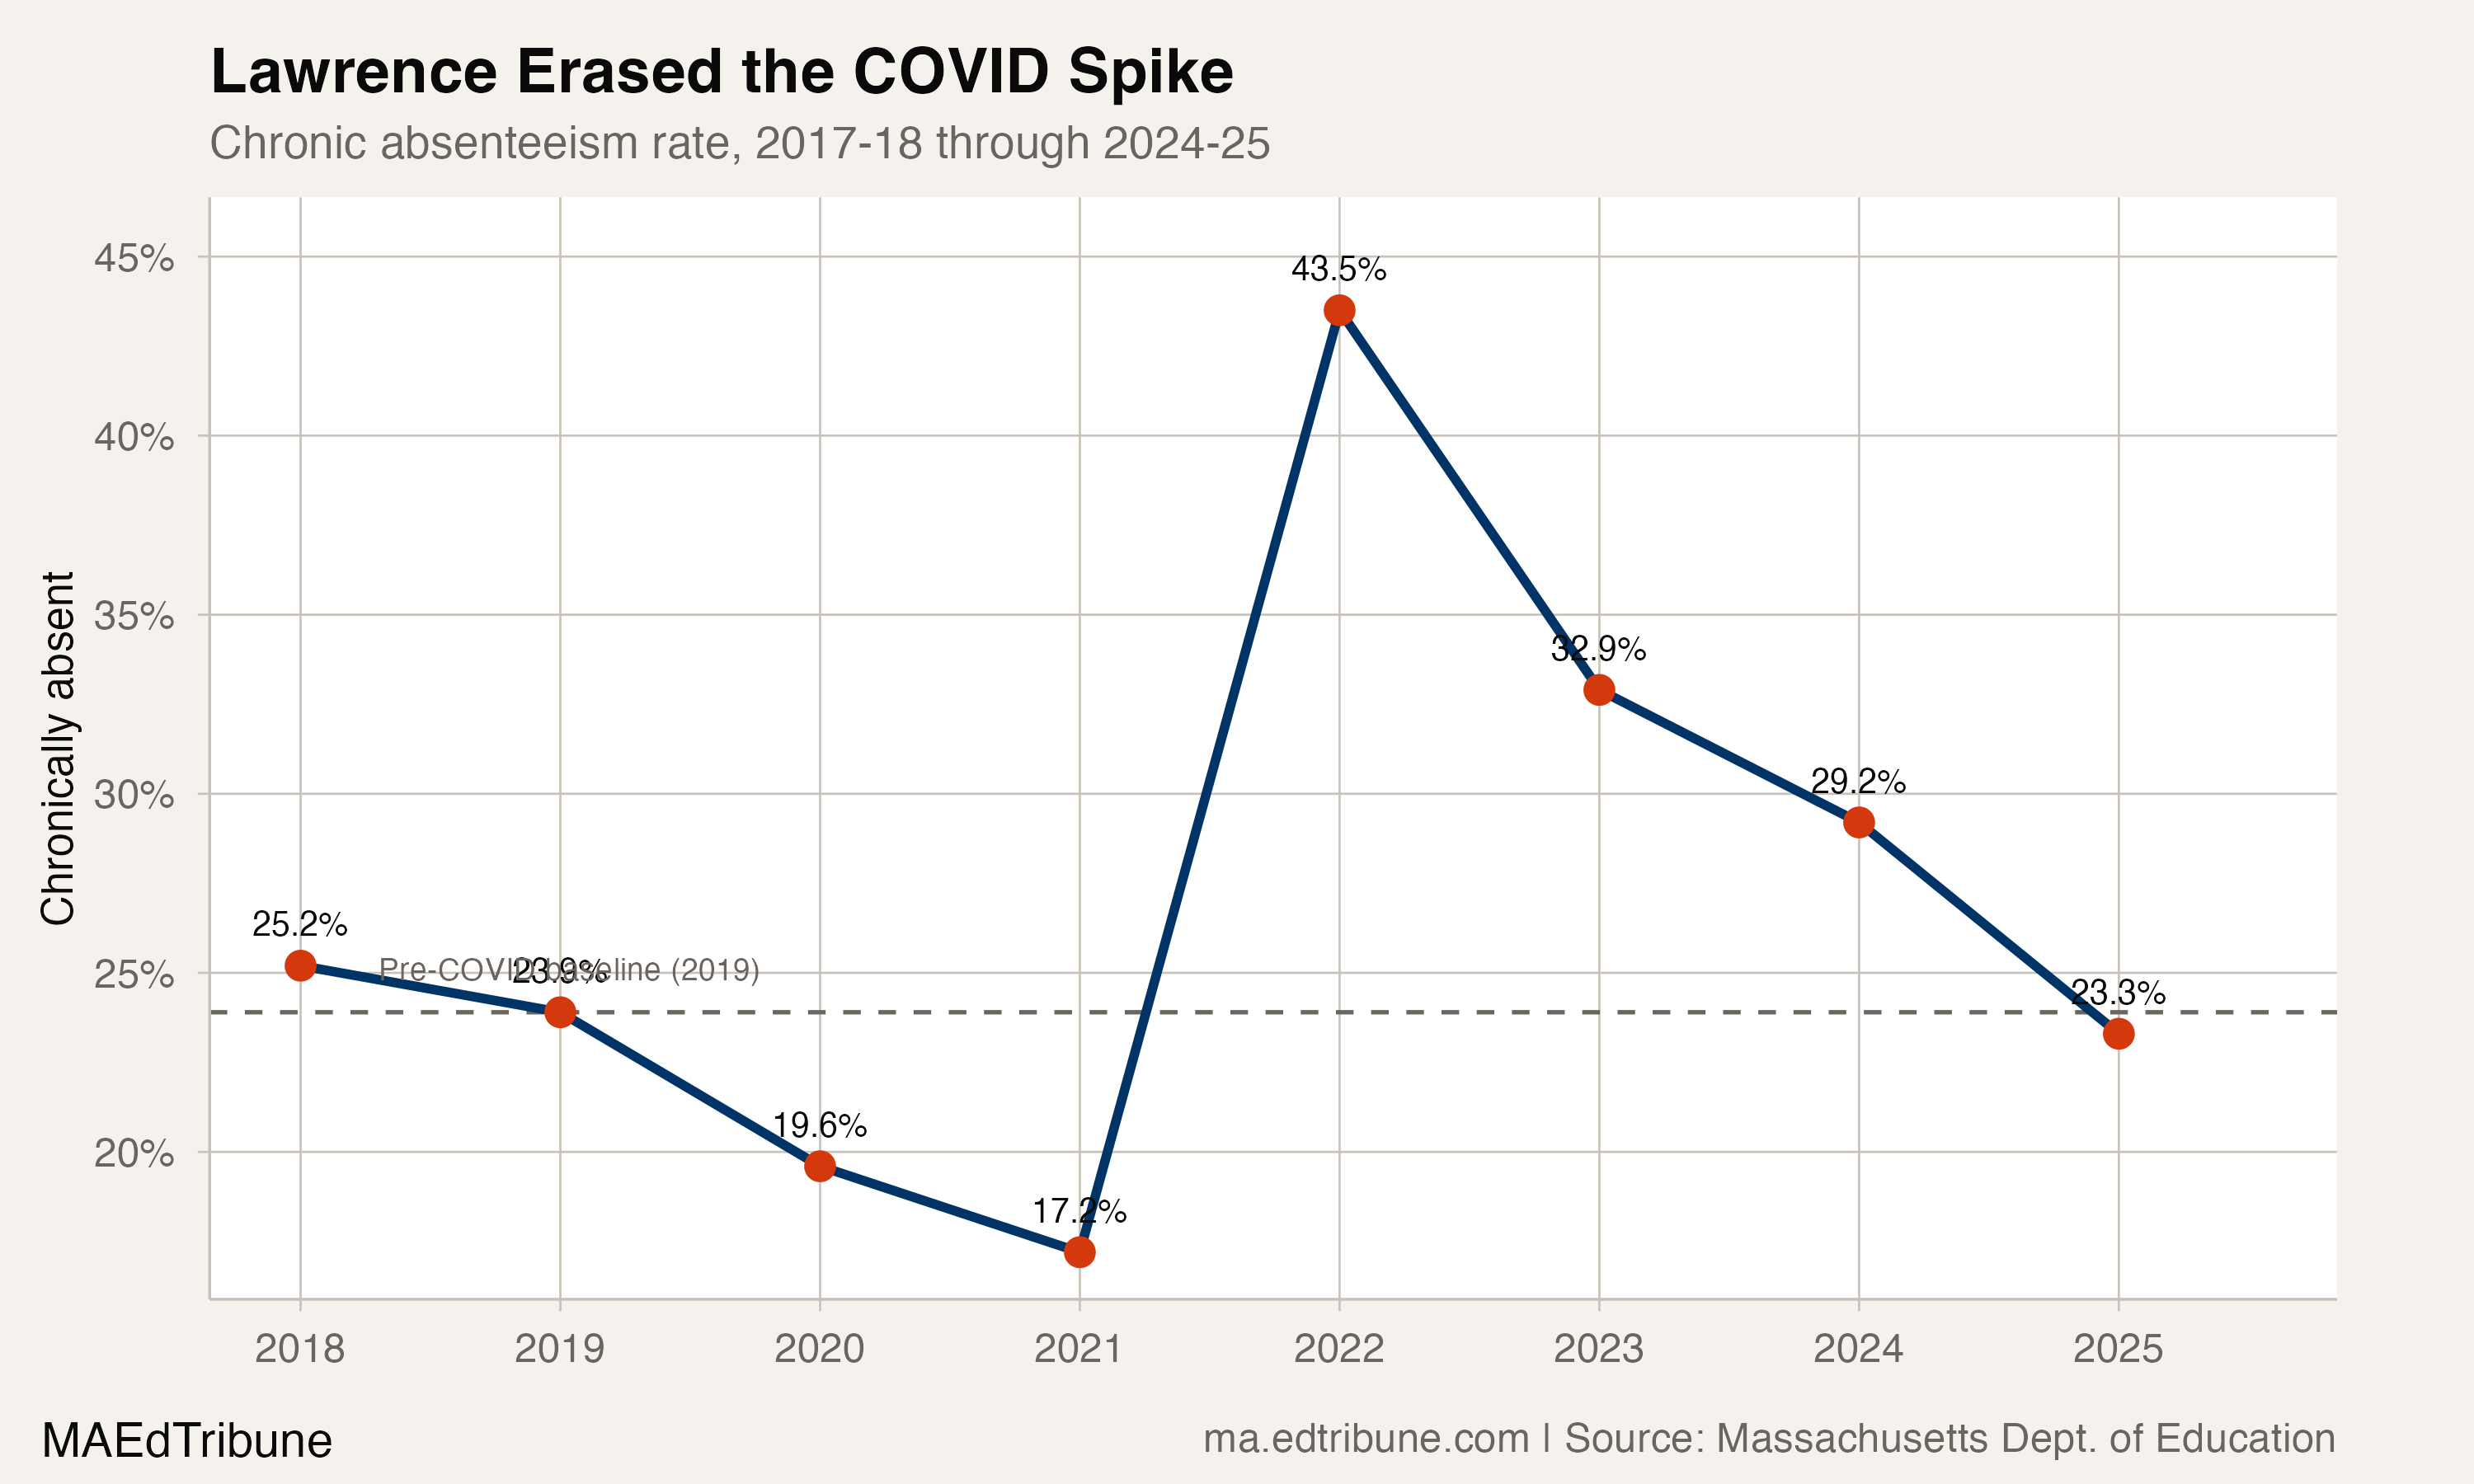
Lawrence cut chronic absenteeism from 43.5% to 23.3%, 0.6 points below its pre-COVID rate. Among Massachusetts' nine largest Gateway Cities, it stands alone.
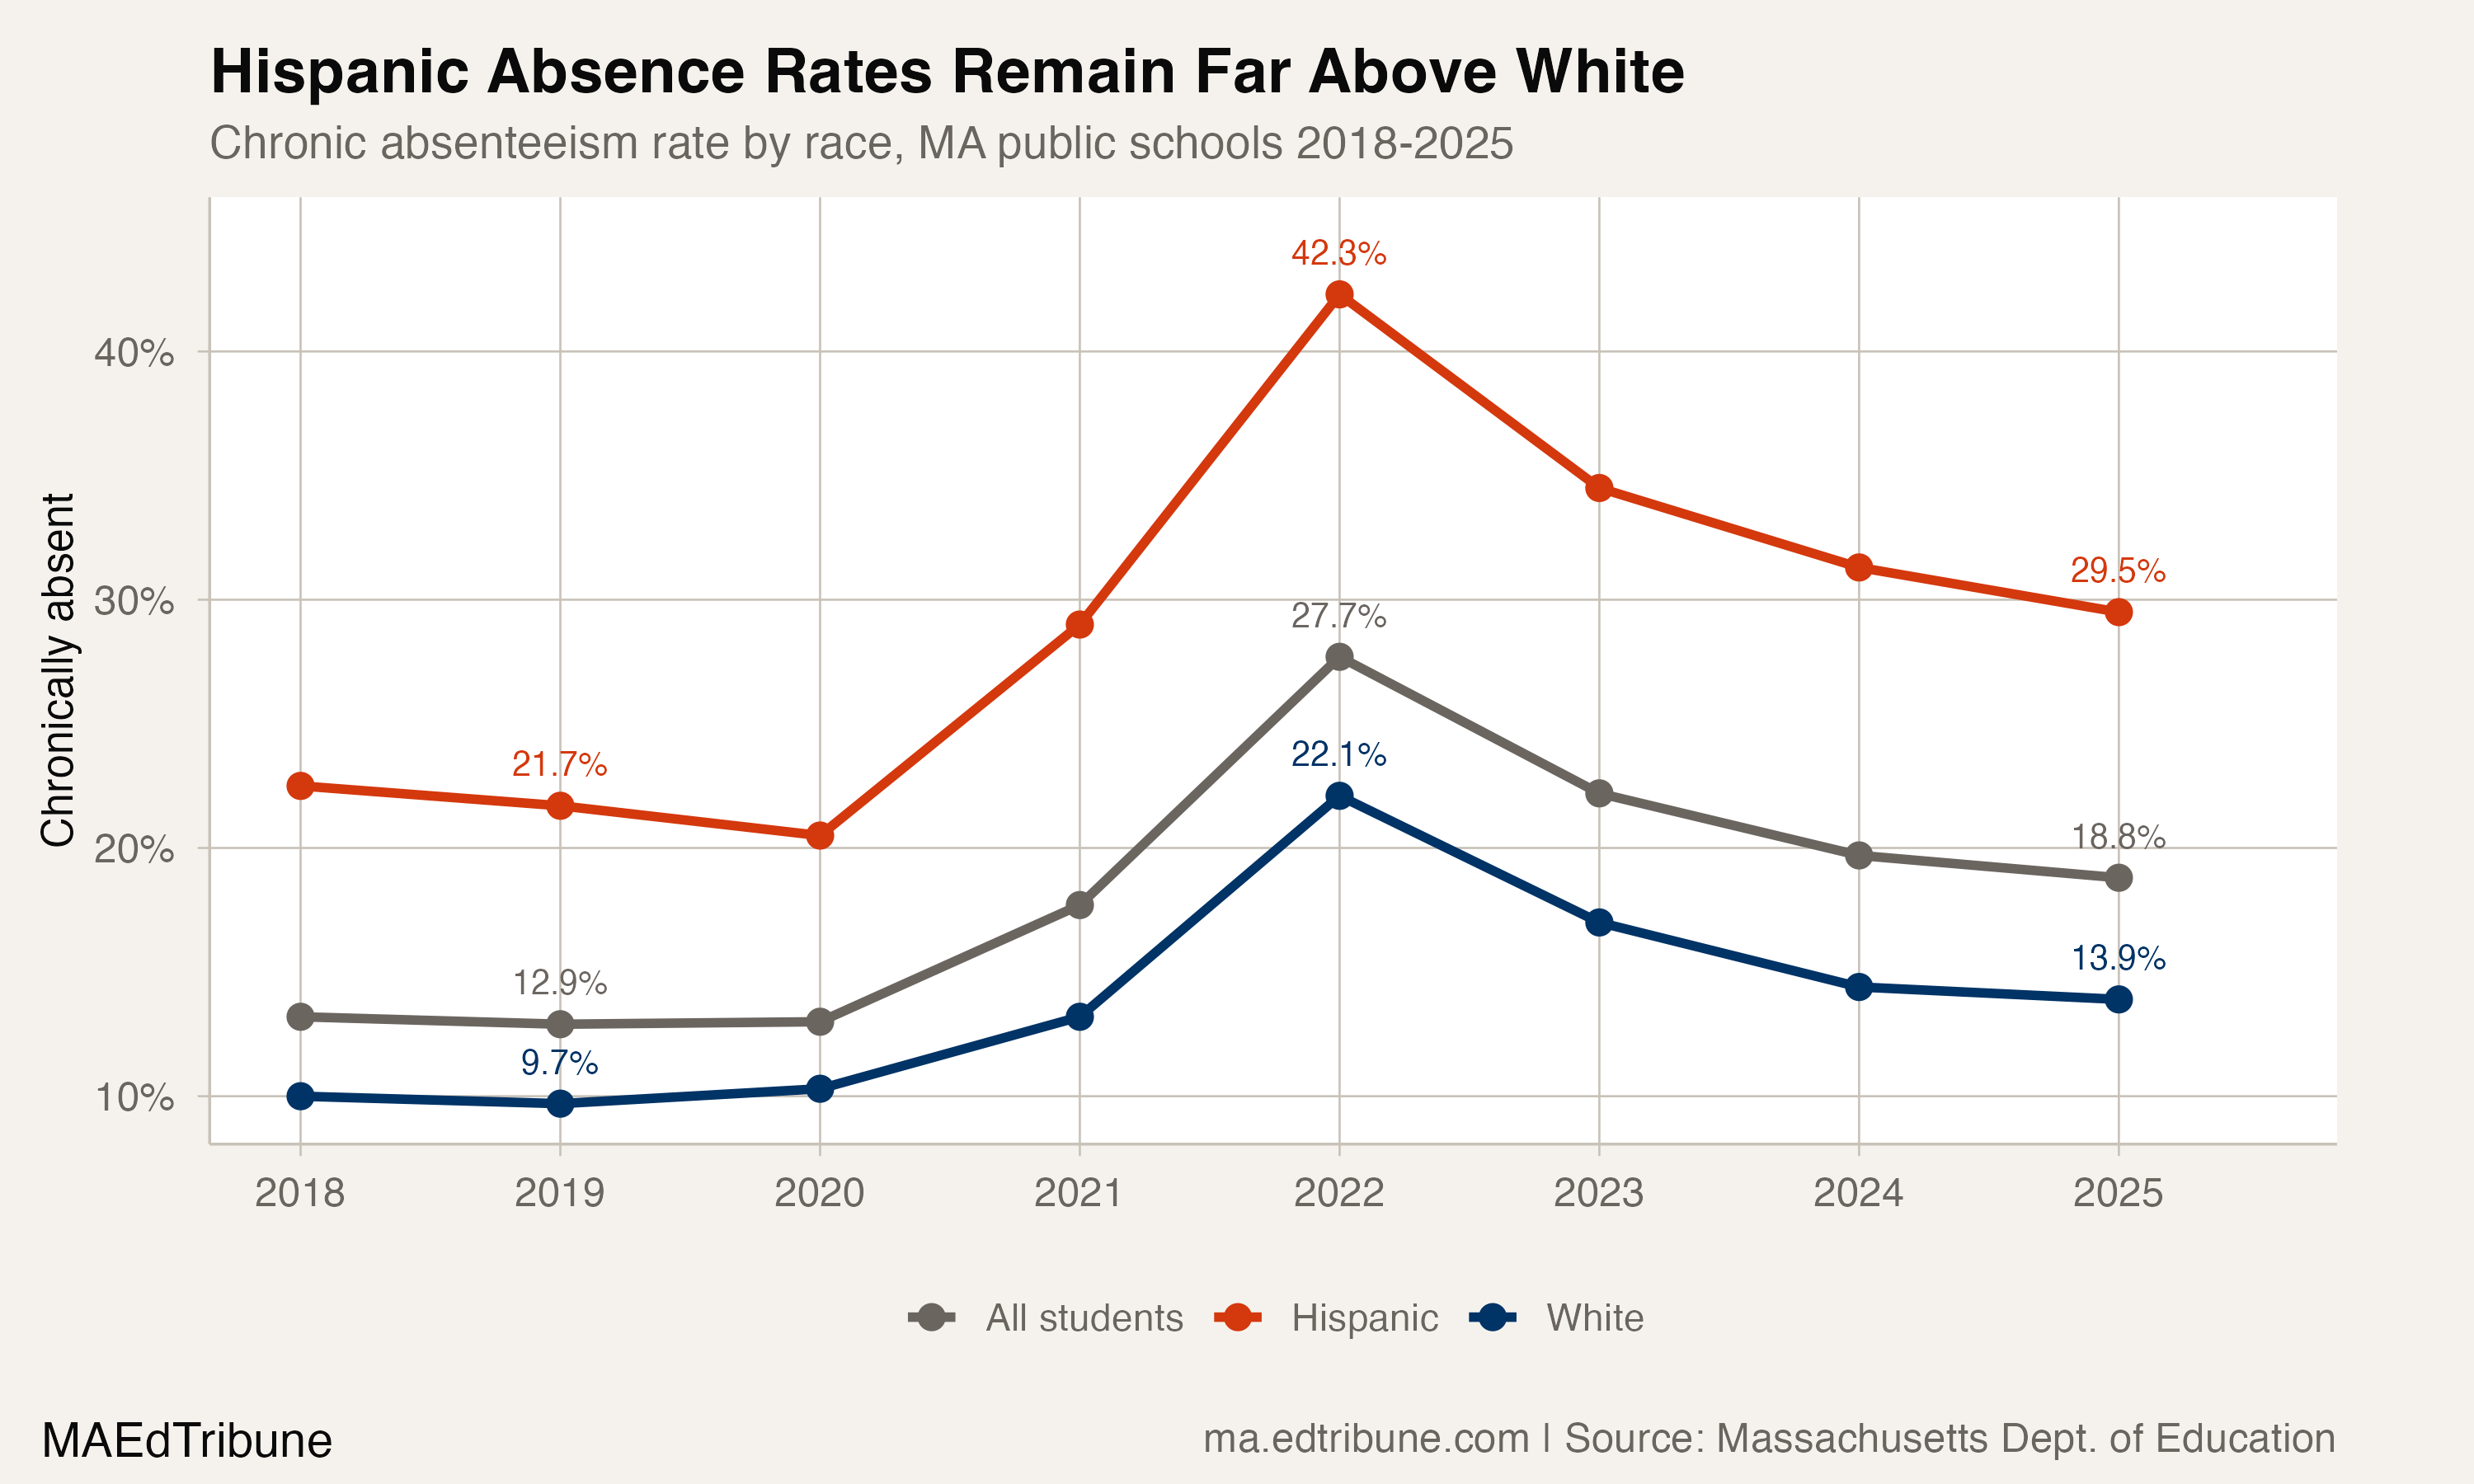
The Hispanic-white chronic absence gap in MA is 3.6 points wider than pre-COVID. In Boston and Framingham, over 40% of Hispanic students miss school.
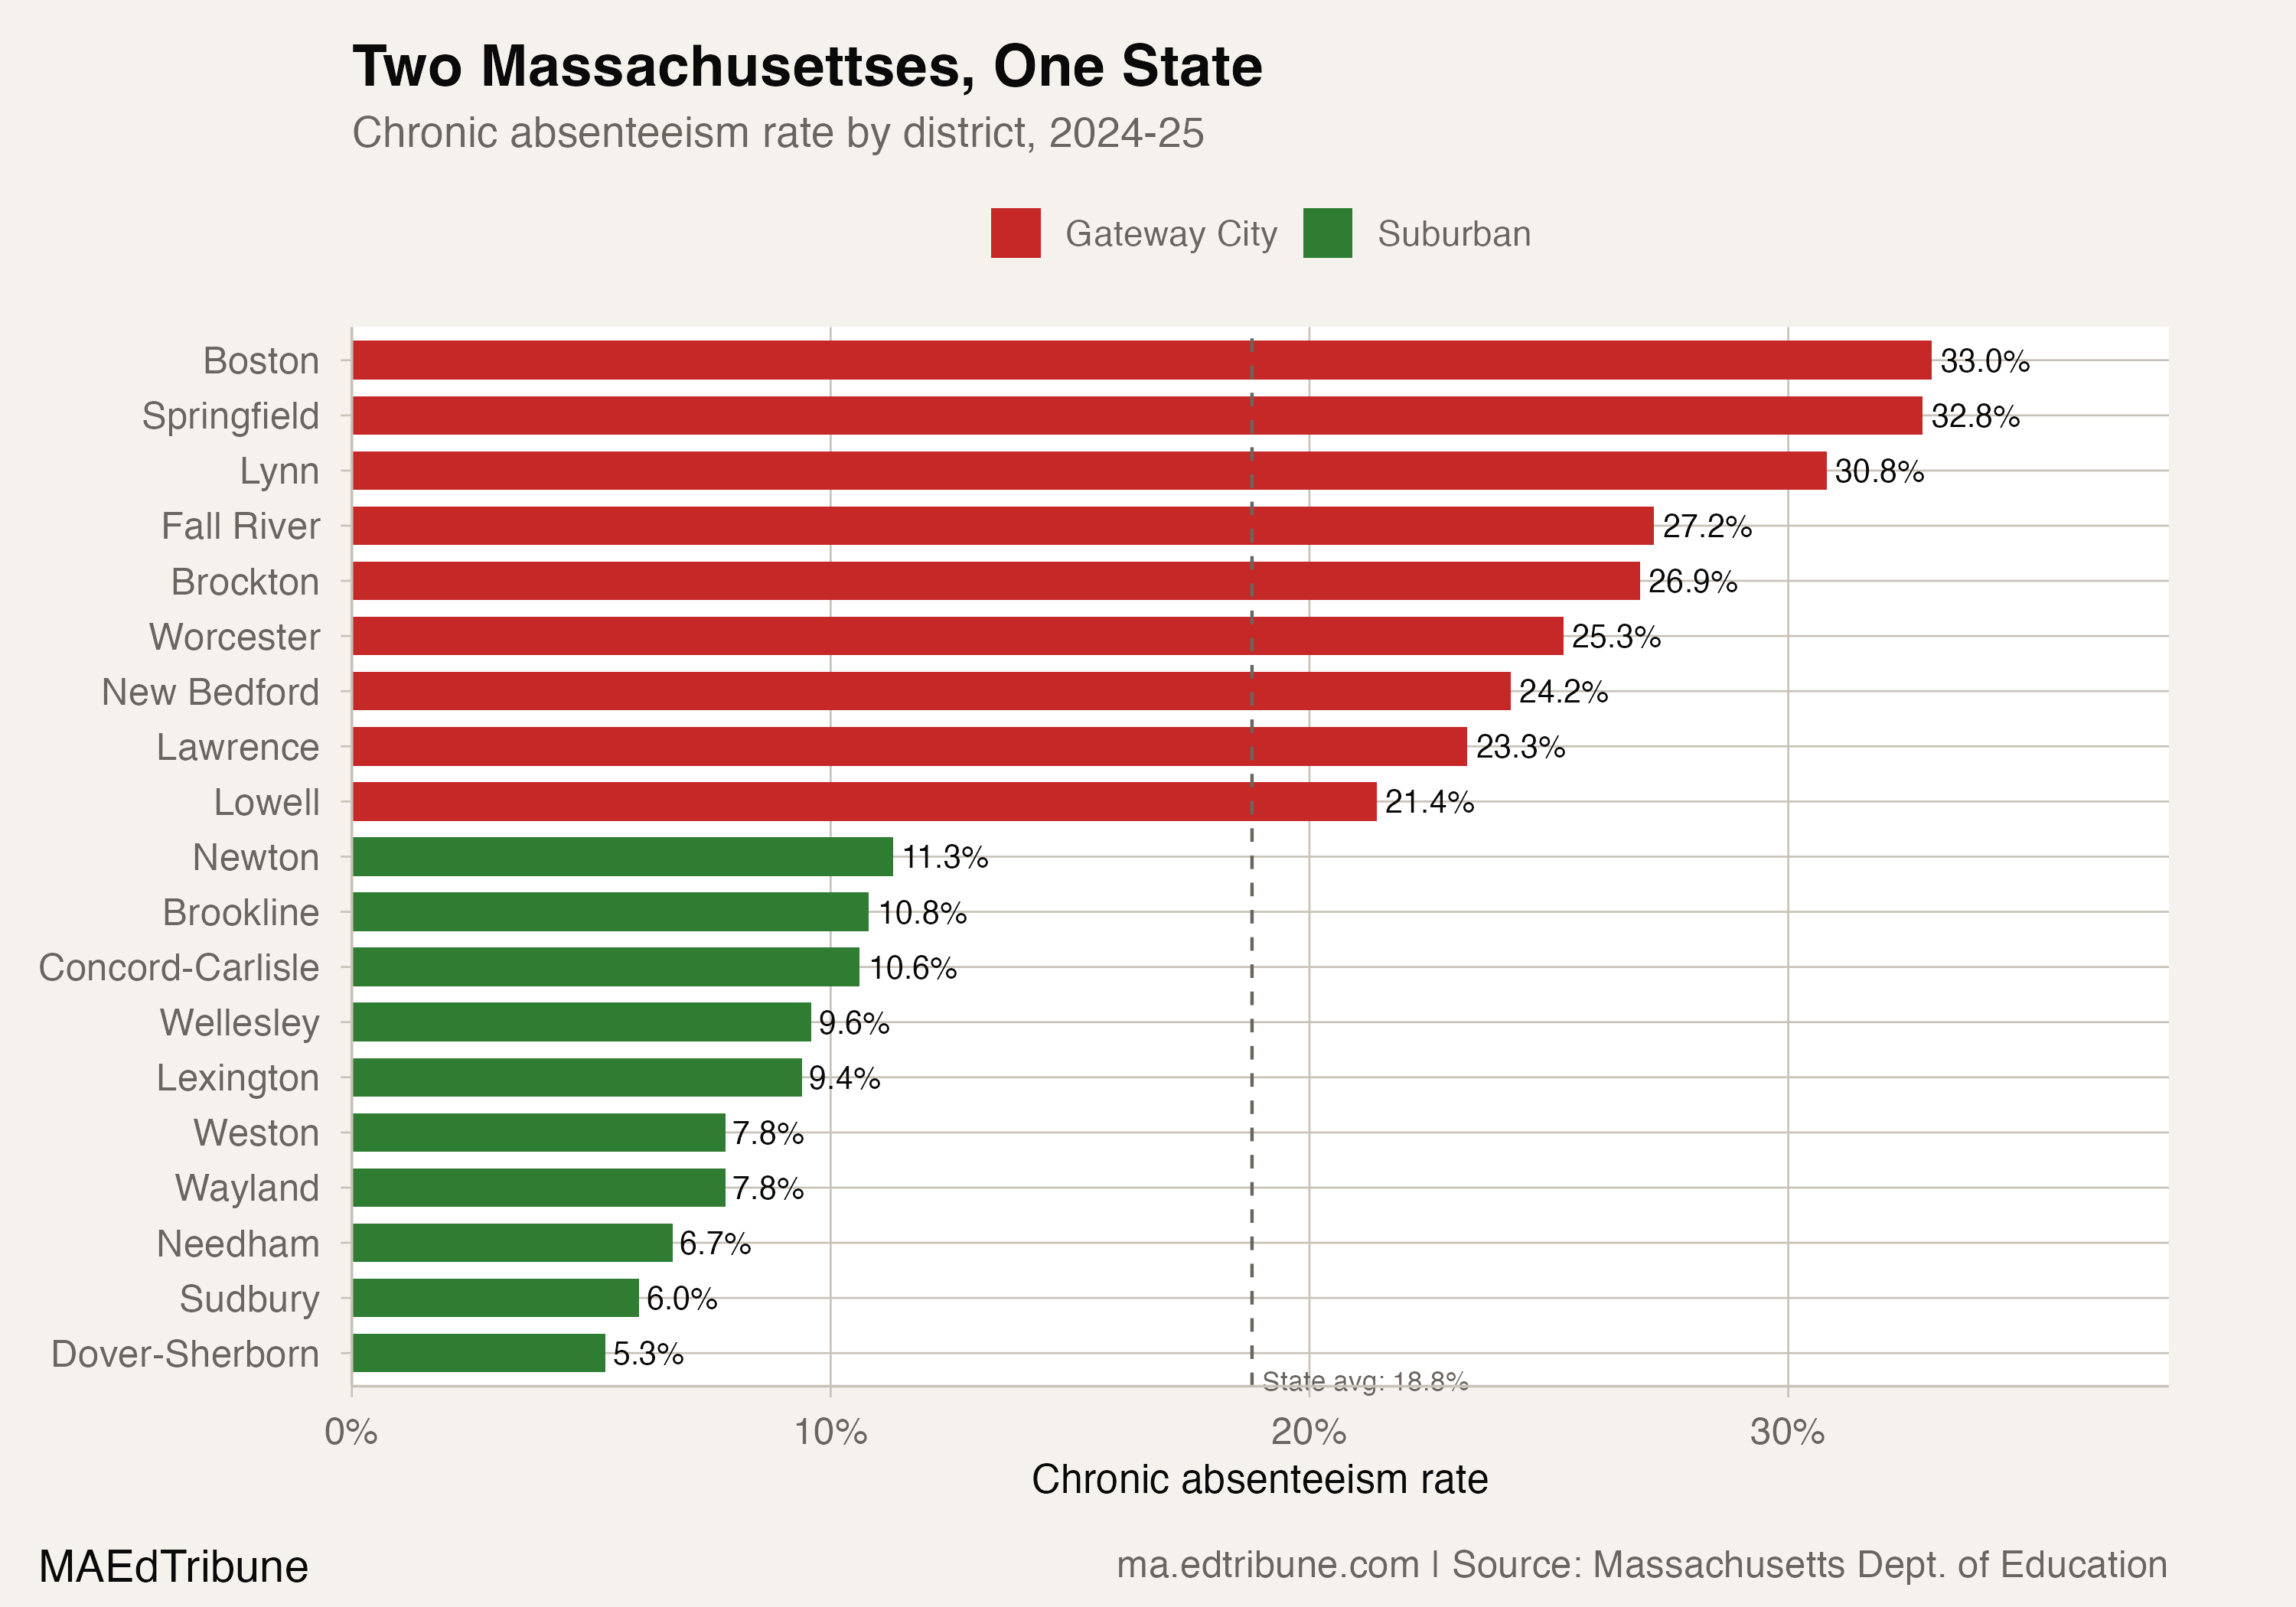
The median chronic absenteeism rate in Massachusetts Gateway Cities is 26.9%, more than triple the 8.6% suburban median, a gap that widened 2.2 points since COVID.
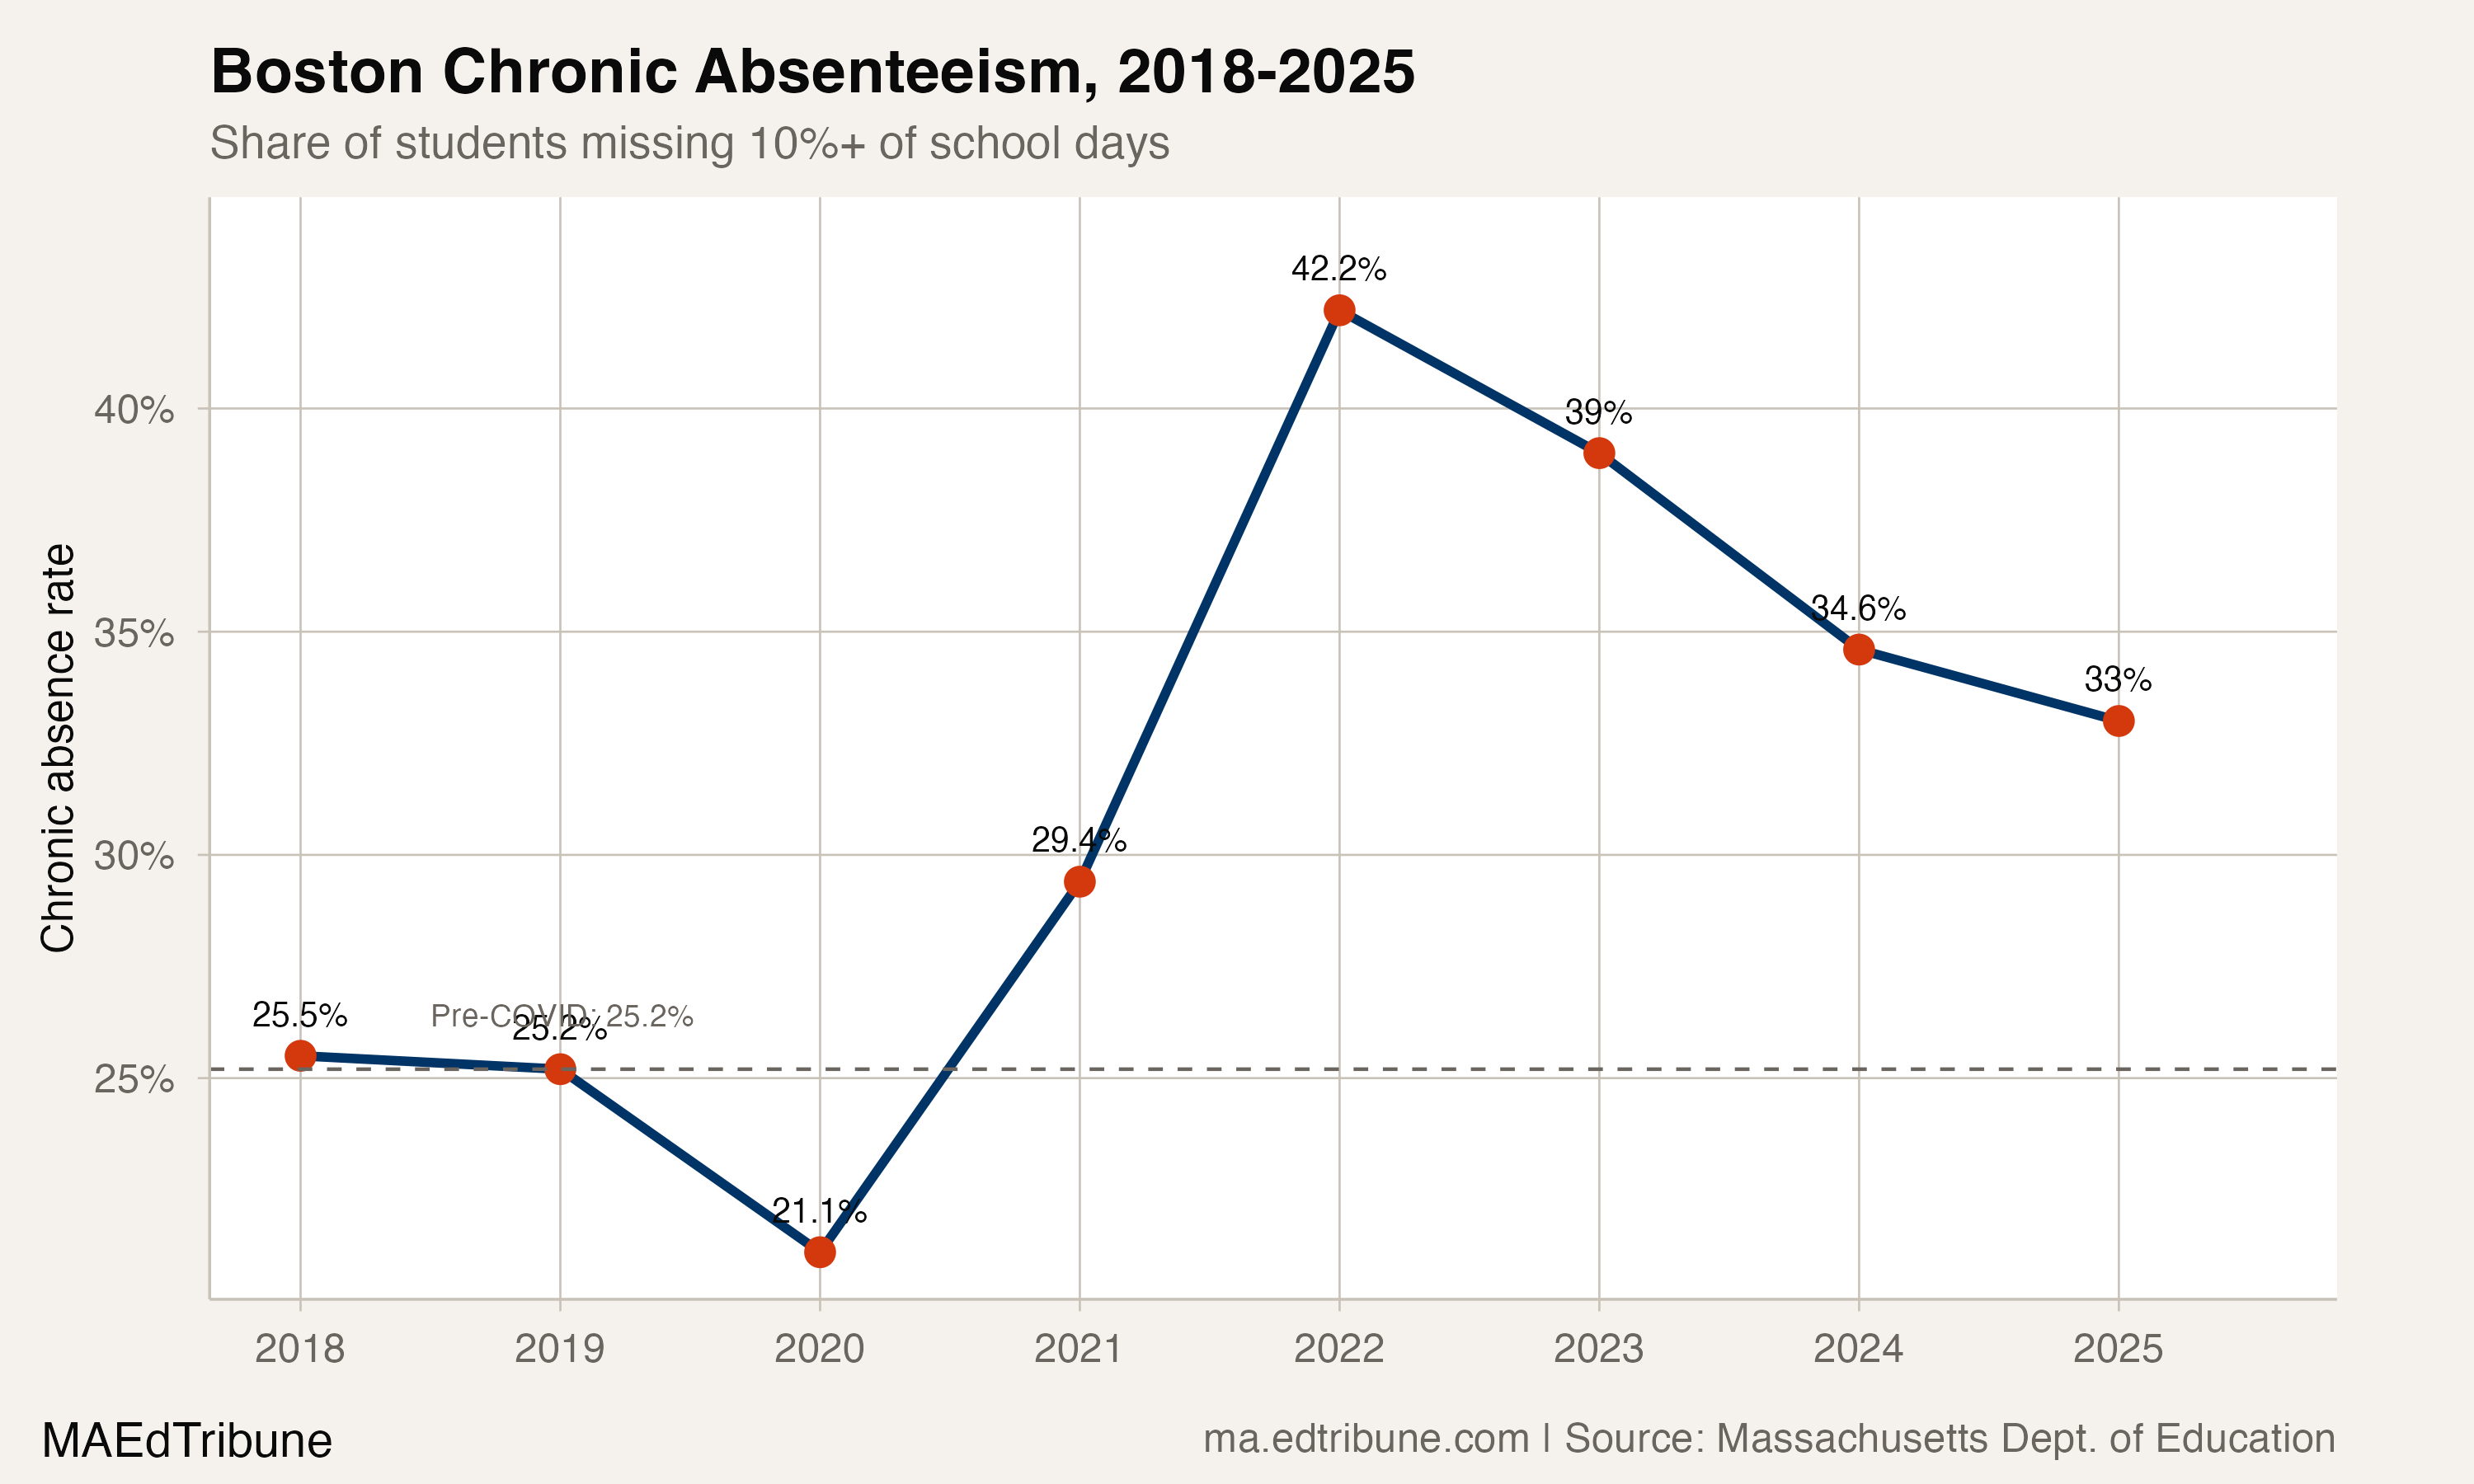
Boston Public Schools cut chronic absenteeism from 42.2% to 33.0% since 2022, but still sits 7.8 points above pre-COVID levels. Hispanic students and students receiving special education face rates above 40%.
42 of 393 Massachusetts districts have brought chronic absenteeism back to pre-COVID levels. Voc-tech schools recovered at nearly triple the statewide rate.
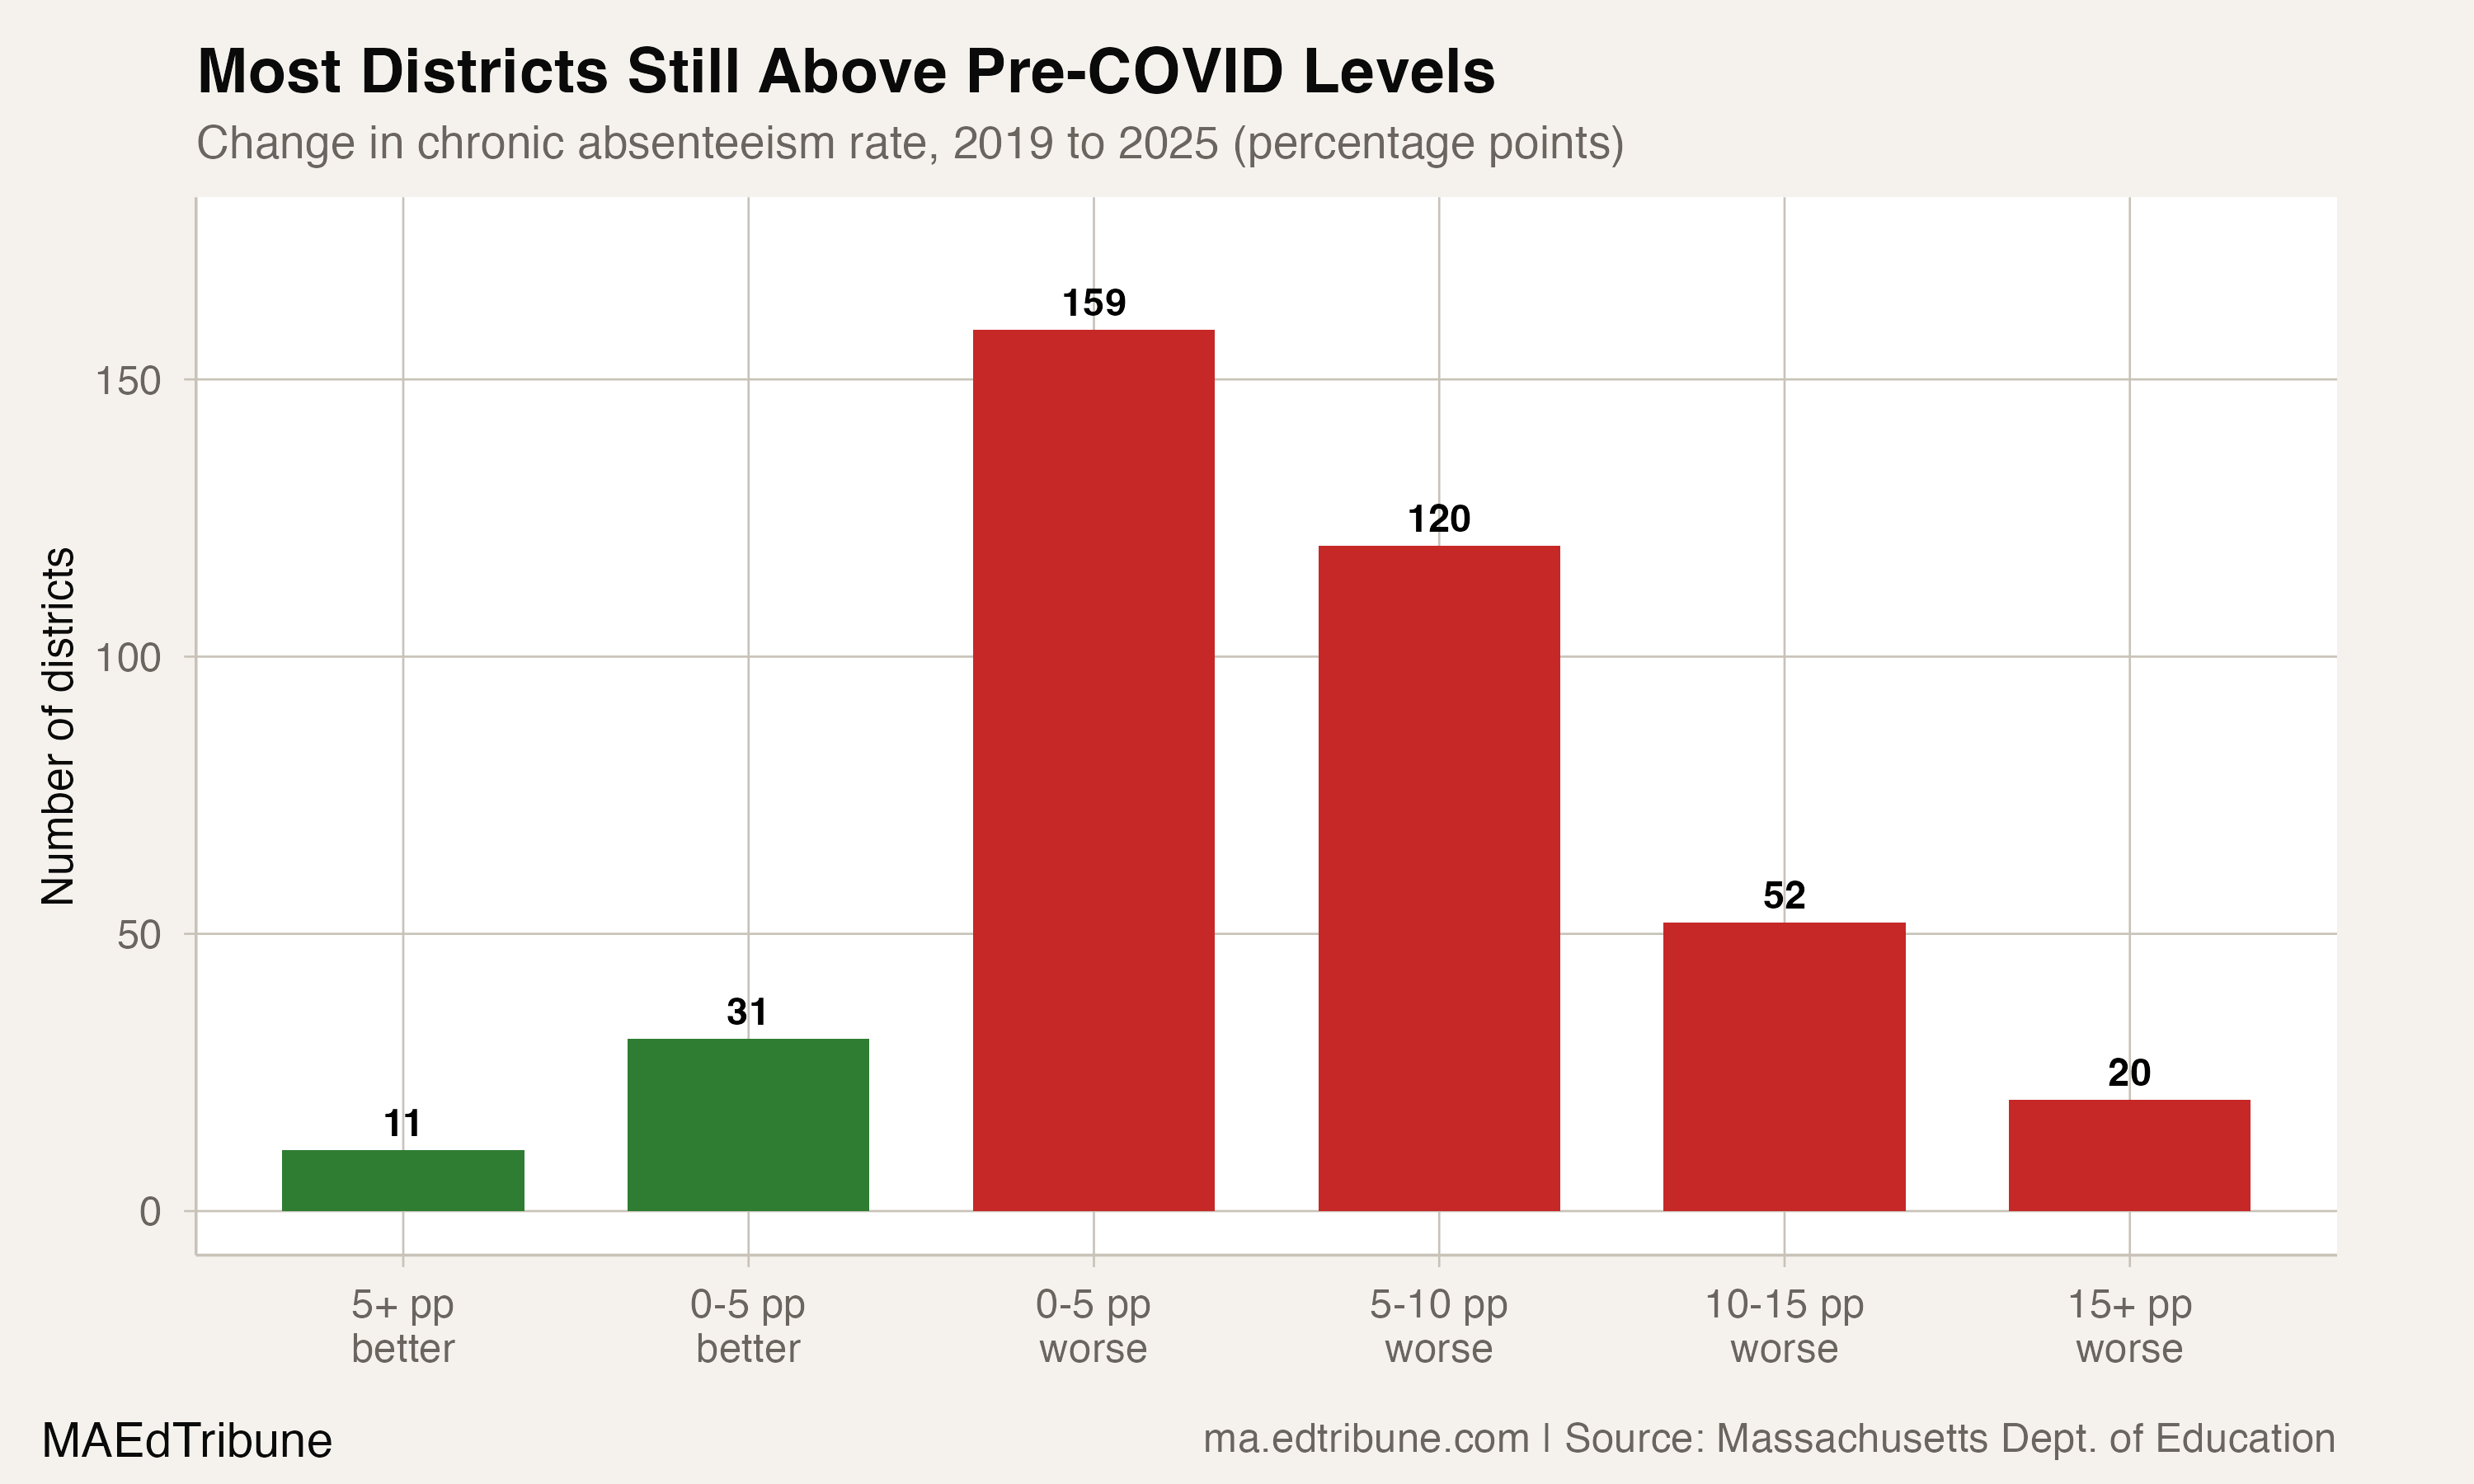
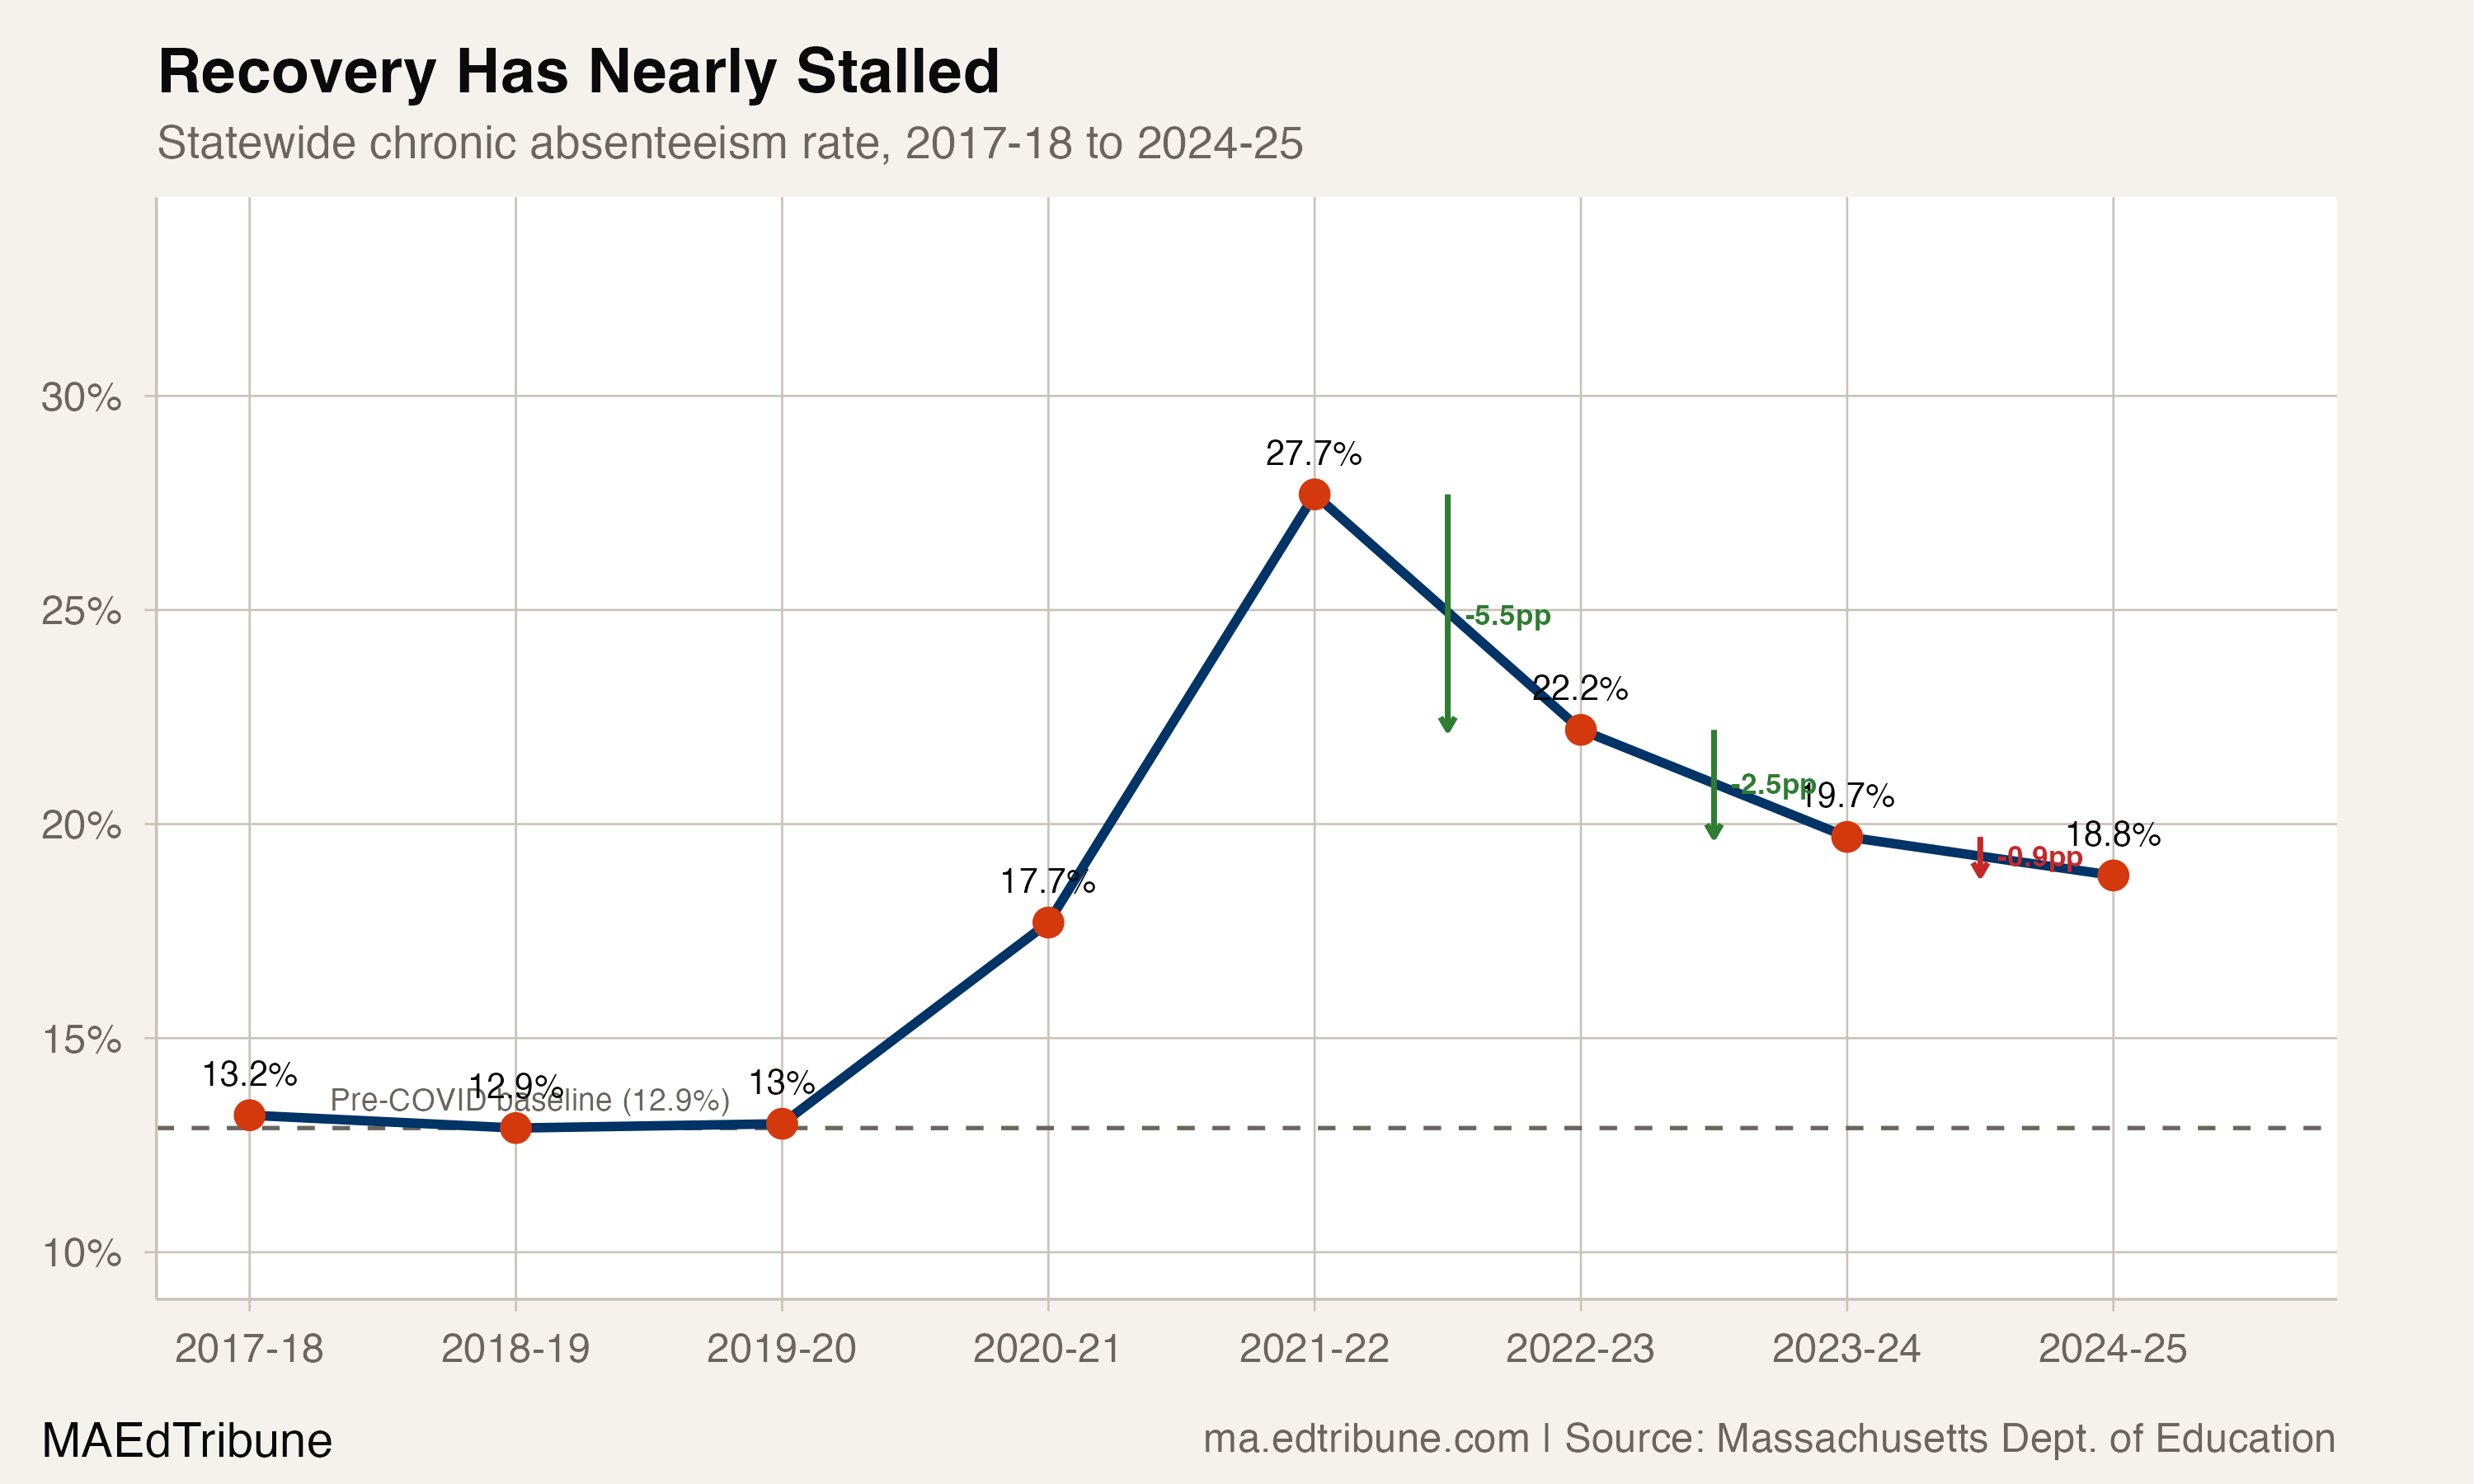
After three years of improvement, Massachusetts chronic absenteeism recovery has nearly stopped. Annual gains shrank from 5.5 points to under 1, leaving 89% of districts above pre-COVID rates.
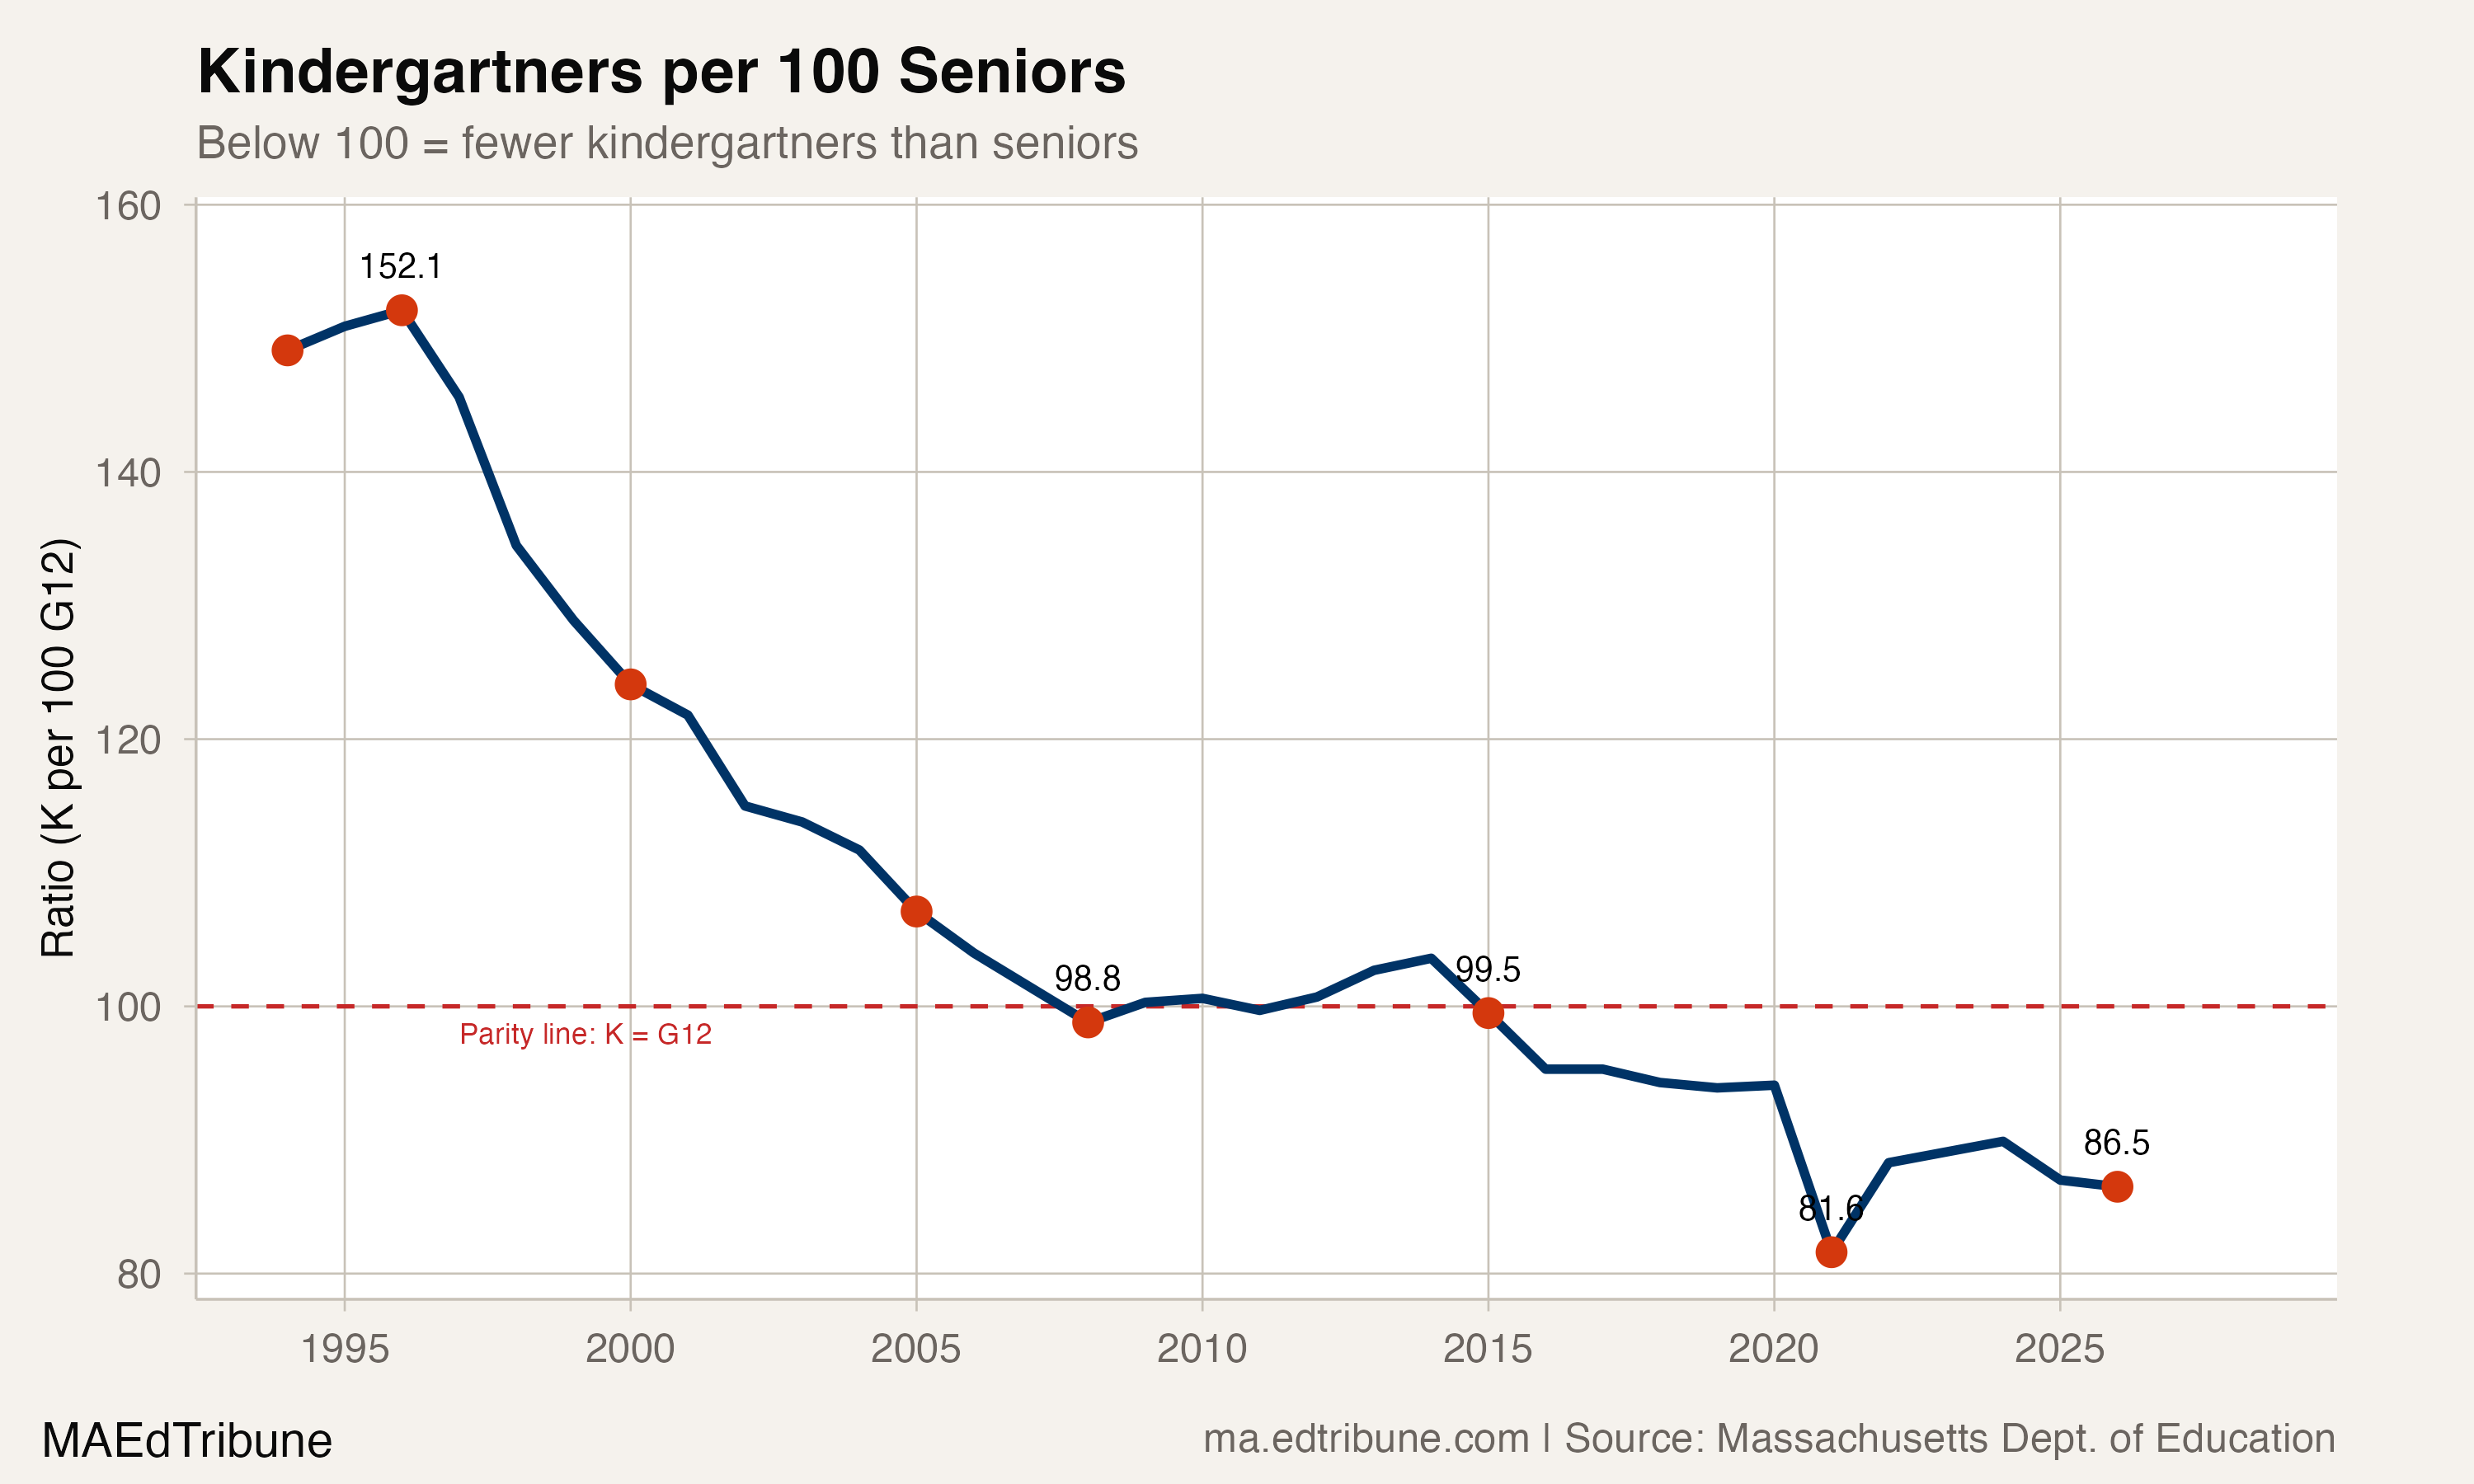
Massachusetts kindergarten enrollment has fallen below grade 12 for 12 straight years, a pipeline inversion that guarantees smaller schools for a generation.
One in four traditional districts recorded their lowest enrollment in 33 years of state data, with Western MA and Cape Cod hit hardest.